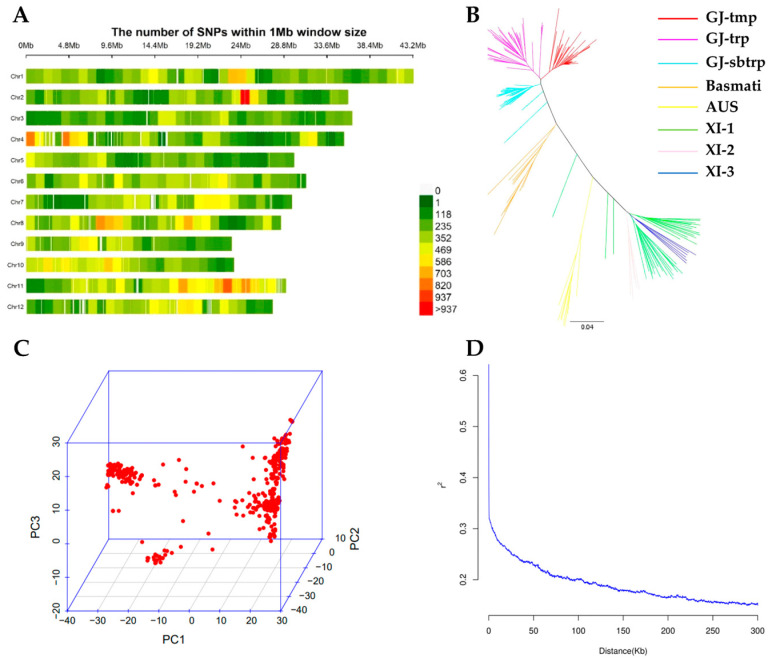
Figure 3.
Genomic distribution of single nucleotide polymorphism (SNP) markers and population structure and linkage disequilibrium (LD) analysis of the population of 195 rice accessions. (A) Distribution of SNP markers used in GWAS. (B) Neighbor-joining (NJ) tree. GJ, Geng/Japonica. XI, Xian/Indica. tmp, temperate. trp, tropical. sbtrp, subtropical. (C) Principal component analysis (PCA) plots. (D) LD decay analysis.

