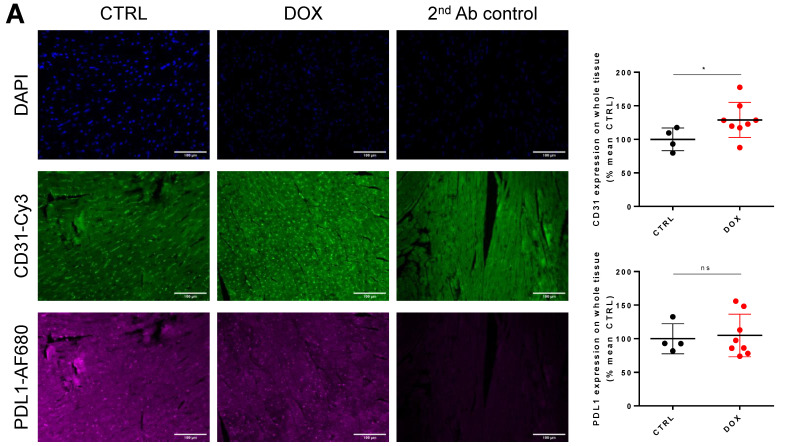
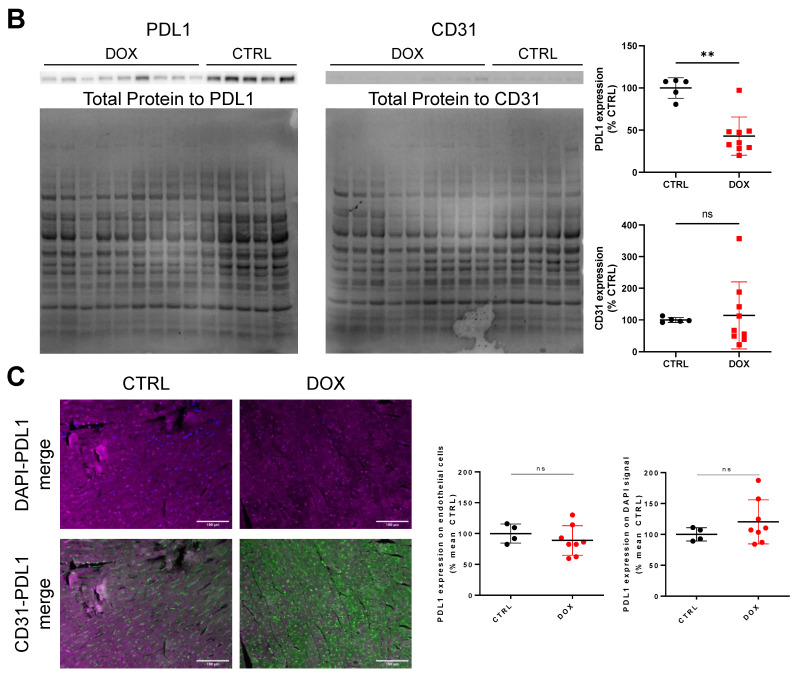
Figure 4.
Immuno-histological and Western blot validation of flow cytometry findings. (A) Left Exemplary micrographs of DAPI, CD31 and PDL1 expression (with secondary Ab control) in cardiac tissue from control (CTRL) and Doxorubicin (DOX) treated animals. Right Quantified CD31 and PDL1 signal intensity over whole tissue normalized to CTRL group (n = 4–8, Mann–Whitney test, *: p < 0.05). (B) Left Western blot micrographs stained for PDL1 and CD31 from whole tissue lysates with corresponding total protein stains. Right Quantified expression of PDL1 and CD31 from micrographs on the left normalized to CTRL group (n = 5–9, Mann–Whitney test, **: p < 0.01) (C) Left and Middle Exemplary merged micrographs of DAPI-PDL1 and CD31-PDL1 from CTRL and DOX groups. Right Quantified PDL1 signal intensity co-localized with DAPI and CD31 signal (n = 4–8, Mann–Whitney test). Scale bars depict 100 µm. ns: not significant.


