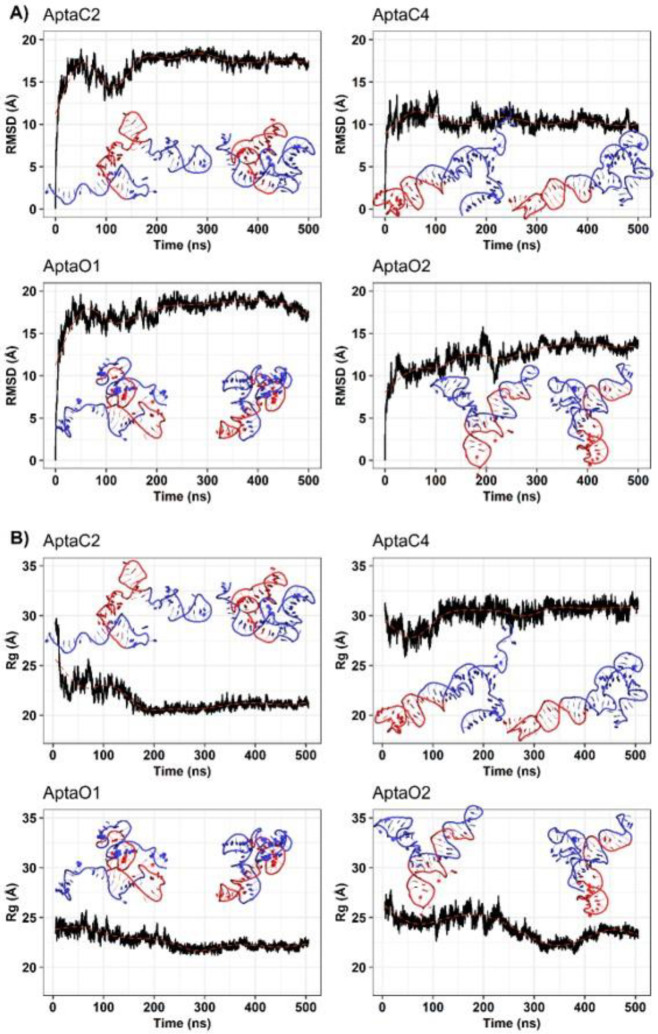
Figure 5.
Root-mean-square deviations (A) and radius of gyration (B) throughout the molecular simulations. Aptamer structure representations corresponding to the initial production structure and the central structure resulting from clustering analysis of simulation are displayed within each plot. The regions of the adapter and central core are depicted in blue and red, respectively.

