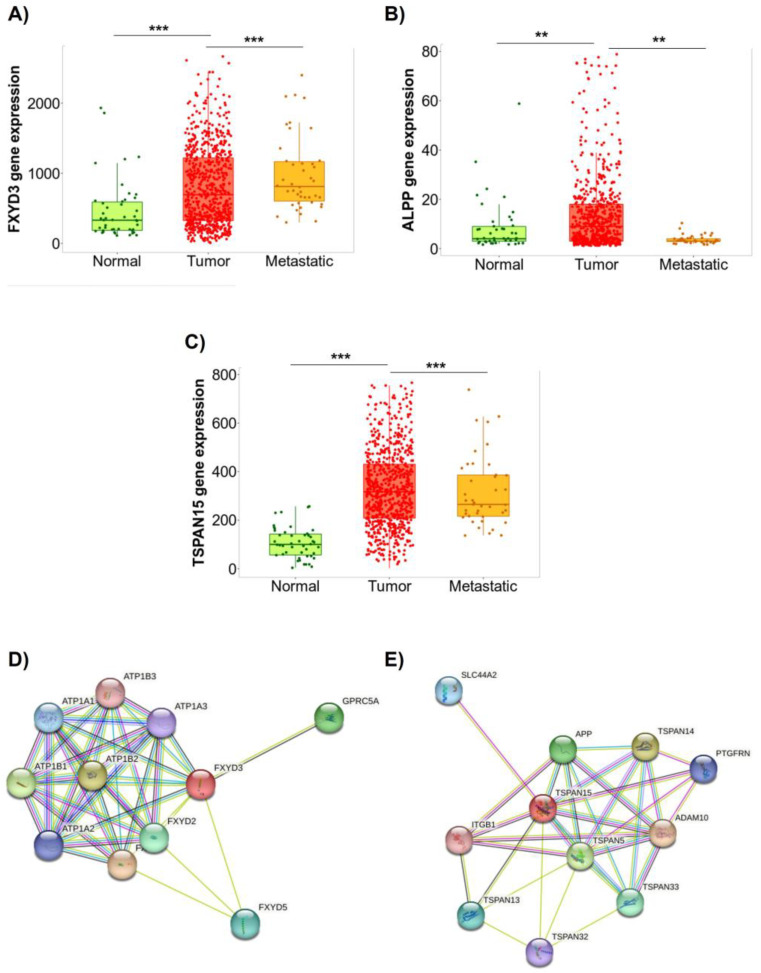
Figure 10.
Gene expression profile of the selected targets in ovarian cancer and PPI network analysis. Samples from ovarian cancer patients comparing normal, primary site tumor, and metastatic tissues from genetic chip data available in the TNMplot database for (A) FXYD3, (B) ALPP, and (C) TSPAN15. The y axis represents mRNA expression, and the x axis represents the studied groups. The main signaling pathways were triggered by (D) FXYD3 and (E) TSPAN15 in ovarian cancer by STRING database. (**) indicates p value < 0.05. (***) indicates p value < 0.001.

