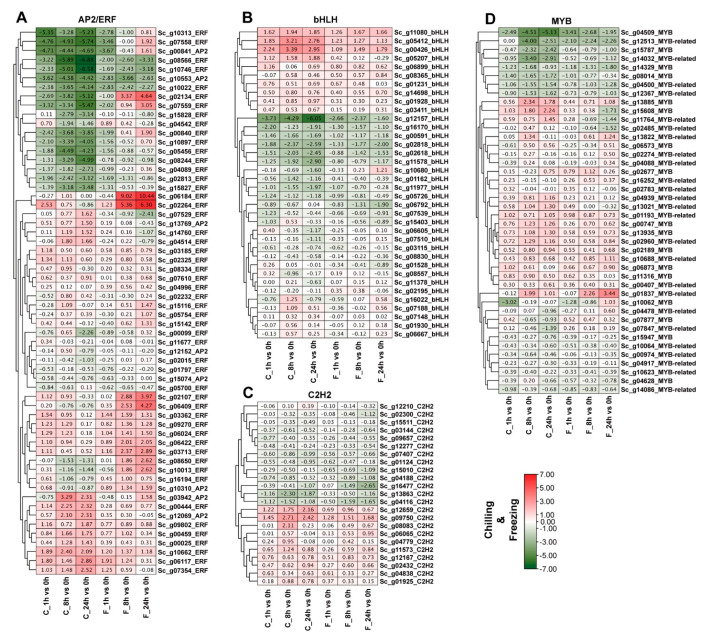
Figure 7.
Expression analysis of the top four TF family genes was examined using hierarchical clustering in different time-series of chilling and freezing stresses. FPKM values of representative transcript levels of TF members. The standardized expression data was used to generate a heatmap with hierarchical clustering based on the Manhattan correlation with average linkage using the MeV software package. Expression levels of (A) AP2/ERF, (B) bHLH, (C) MYB, (D) C2H2-zinc finger genes under chilling and freezing stresses at 1, 8, and 24 h. The heatmap shows the change in the average log2 (fold-change) of each transcript.

