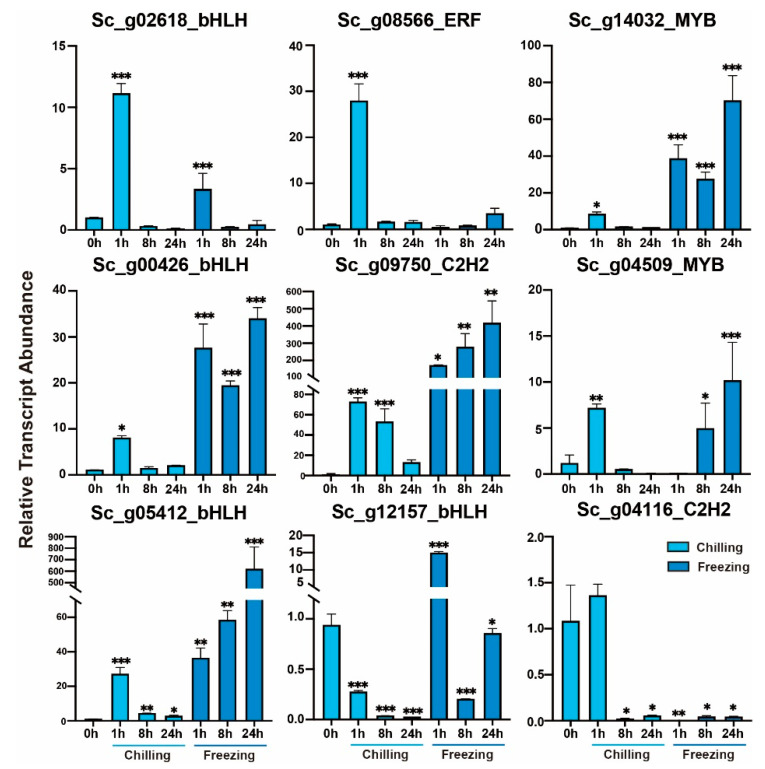
Figure 9.
The relative transcript abundance analysis of nine represented TFs in response to chilling (4 °C) and freezing (−4 °C) stresses by RT-qPCR at 0, 1, 8, and 24 h. Data are represented as means ± SD of three independent biological replicates of each treatment. The significant difference compared with the control (0 h), LSD multiple comparison tests: * p < 0.05, ** p < 0.01, ***, p < 0.001.

