Figure 4.
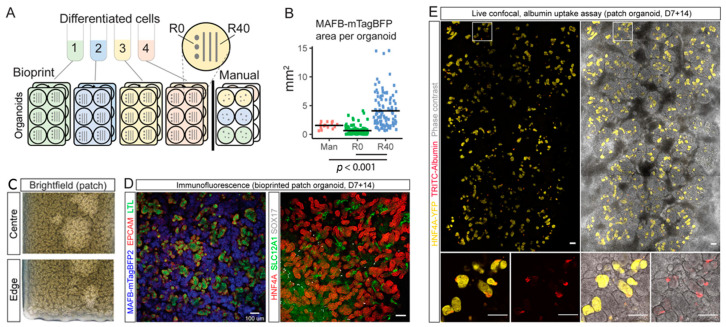
Cellular extrusion bioprinting improved nephron formation in kidney organoid, as compared to manual generation. (A) A schematic of the protocol for manual versus bioprinted kidney organoid formation (R40, R0). R40 and R0 were generated from 1.1 × 10⁵ differentiated iPSC (MAFBmTAGBFP2GATA3mCherry) cells, and manual organoids from 2.3 × 10⁵ cells. (B) Comparison of MAFB reporter area in manual and bioprinted kidney organoids. Larger area was observed in R40 organoids, suggesting greater nephron number formation. Bars indicate mean. R40-Man, p = 2.1 × 10⁻⁵, R40-R0, p = 2 × 10⁻¹⁶. (C) Uniform formation of nephron structures in the bioprinted kidney organoid patch, analyzed by brightfield imaging. (D) Nephrons showed expression of markers of proximal tubules (LTL (left panel; green) and HNF4A (right panel; red)), podocytes (mTagBFP2 (left panel; blue)), nephron epithelium (EPCAM (left panel; red)), distal tubule/loop of Henle TAL (SLC12A1 (right panel; green)), surrounded by interstitial endothelial cells (SOX17 (right panel; grey)). Analyzed by confocal immunofluorescence imaging. (E) Patch organoid was generated from proximal tubule-specific iPSC reporter line (where yellow fluorescent protein (YFP) was inserted under the control of the HNF4A promoter), following incubation in TRITC-albumin substrate. Live confocal imaging shows uptake of TRITC-albumin (red) into YFP-positive proximal tubules (yellow). Small panels below show higher magnification of the outlined areas, with and without phase-contrast overlays. Scale bars = 100 μm. Reproduced with permission from [68], copyright 2020 Springer Nature Ltd.

