Figure 2.
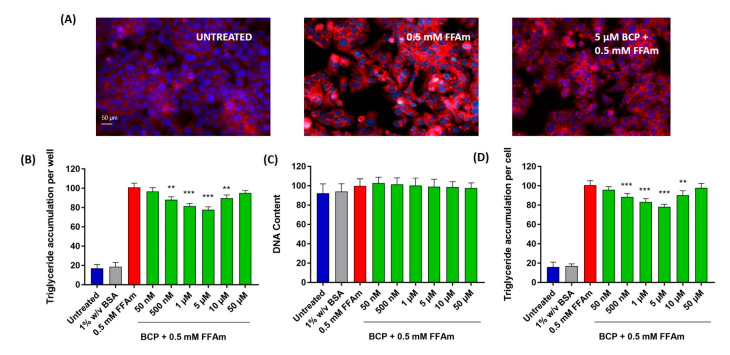
Lipid accumulation in HepG2 cells. BCP attenuates intracellular lipid accumulation in steatotic HepG2 cells without altering the cell number (DNA content). (A) Representative images of AdipoRed (red, triglycerides) and NucBlue (blue, nuclei) stainings; UNTREATED = untreated hepatocytes (control); 0.5 mM FFAm = palmitate and oleate-treated hepatocytes; 5 μM BCP + 0.5 mM FFAm = HepG2 cells co-treated for 24 h with BCP and FFAm. Scale bar: 50 μm. (B) Bar graph summarizing AdipoRed staining experiments to assess triglyceride accumulation per well in untreated cells, BSA-treated cells, 0.5 mM FFAm-treated positive control cells and HepG2 cells treated with 0.5 mM FFAm and various concentrations of BCP for 24 h. (C) Bar graph summarizing the DNA content per well (NucBlue staining). (D) Bar graph showing the triglyceride accumulation per cell, calculated as the ratio of AdipoRed and NucBlue stainings. Data are expressed as percentage change with respect to 0.5 mM FFA control condition (set equal to 100) and represent the mean ± SEM of five independent experiments. ** p < 0.01; *** p < 0.001 vs. positive control (0.5 mM FFAm-treated cells).

