Figure 6.
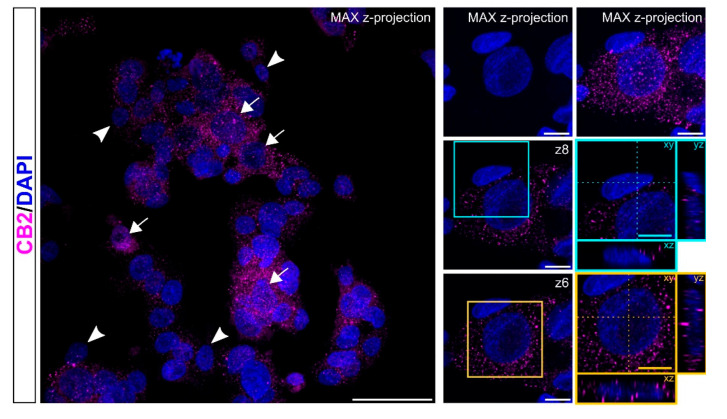
Localization of CB2 receptors. Representative confocal images showing CB2 immunostaining (magenta) in HepG2 cell line. Nuclei are stained with DAPI (blue). Pictures are shown as max z-projections (low magnification; left) with white arrows and arrowheads to highlight CB2high+ cells and CB2low+ cells, respectively, and a single confocal plane with reslicing (right) to better appreciate the intracellular distribution of CB2+ puncta in two of the cells present in the image. The cyan contoured image shows a cell positive for CB2 at low levels; the yellow contoured image identifies a cell with extensive immunolabelling for CB2. Scale bars: 50 µm (low magnification) and 10 µm (high magnification).

