Figure 2.
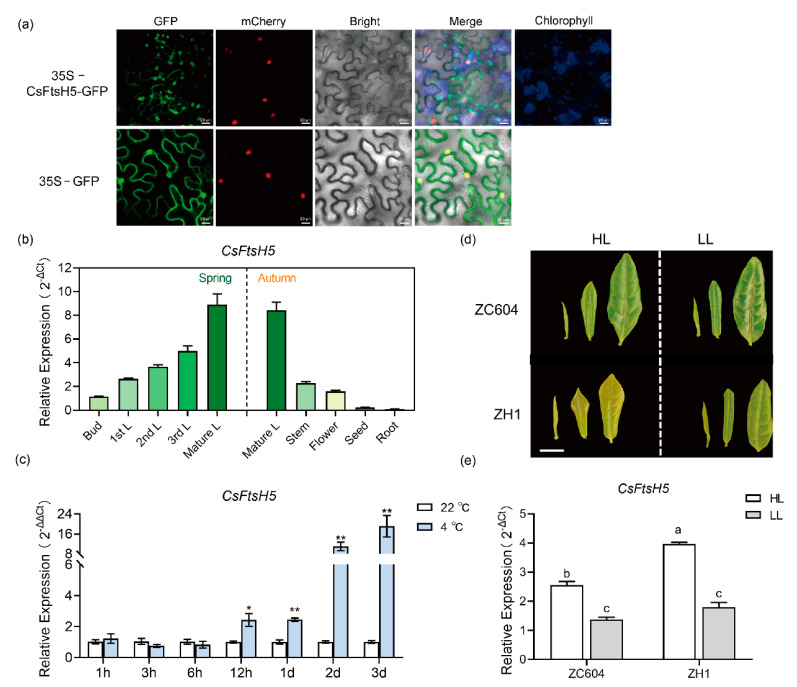
Expression profiles and sub-cellular localization of CsFtsH5. (a) Sub-cellular localization of CsFtsH5 protein in H2B-RFP transgenic Nicotiana benthamiana leaves. The empty 35S-GFP was a positive control. Nuclei are indicated by the H2B-RFP (red), and the chloroplasts are shown in blue. Scale bar = 20 µm. (b)The expression patterns of CsFtsH5 in tea plant tissues, including bud, 1st L, 2nd L, 3rd L, mature L, stem, flower, seed, and root. Samples were collected on April, 2020, and October, 2020. (c) The CsFtsH5 expression in tea plants under 22 °C and 4 °C treatments for 1, 3, 6, and 12 h, as well as 1, 2, and 3 d. Data are shown as the mean ± SEM (n = 3). Asterisks indicate significant differences according to t-tests (* p < 0.05, ** p < 0.01). (d) The phenotype of 2 leaves and 1 bud of ZC604 and ZH1 under 100% and 10% sunlight conditions. Scale bar = 1 cm. (e) The expression patterns of CsFtsH5 in leaves of the green-leaf cultivar of ZC604 cultivar and the yellow-leaf cultivar of ZH1 under 100% and 10% sunlight conditions. Means of three replicates and standard errors are presented; different letters above the column indicate a significant difference at p < 0.05 using LSD’s test. Values in (b,e) are expressed relative to the expression levels of the reference gene using the formula 2−ΔCt. Values in (c) are expressed relative to the expression levels of the 22 °C group using the formula 2−ΔΔCt. CsPTB was used as a reference gene in expression analysis.

