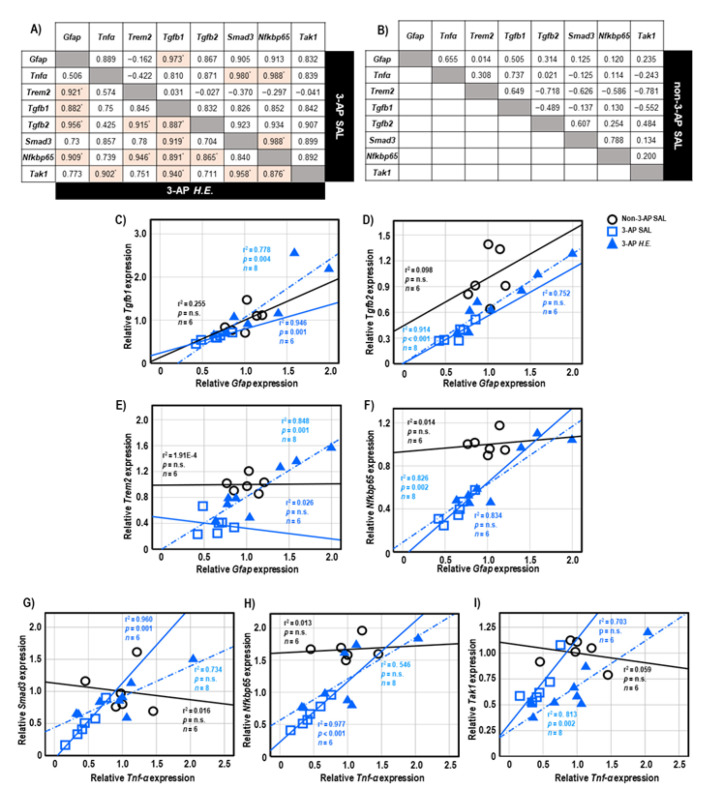
Figure 5.
The tables show the gene correlations in the 3-AP group (upper-right), H.E.+3-AP group (Lower-left), and control group in (A,B). Scatter plots of significant correlations among groups by Spearman correlational analysis. Gene expression of Gfap was significantly correlated with the gene expression of (C) Tgfb1, (D) Tgfb2, (E)Trem2, and (F) Nfkbp65. Gene expression of Tnf-α was correlated with the gene expression of (G) Smad3, (H) Nfkbp65, and (I) Tak1. The p values were adjusted by Bonferroni correction for multiple comparisons. Indicators: * correlation was significant at p < 0.00625 for gene expression data. Indicators: ◯ Non-3-AP SAL group, ☐ 3-AP SAL group, △ 3-AP H.E. group.

