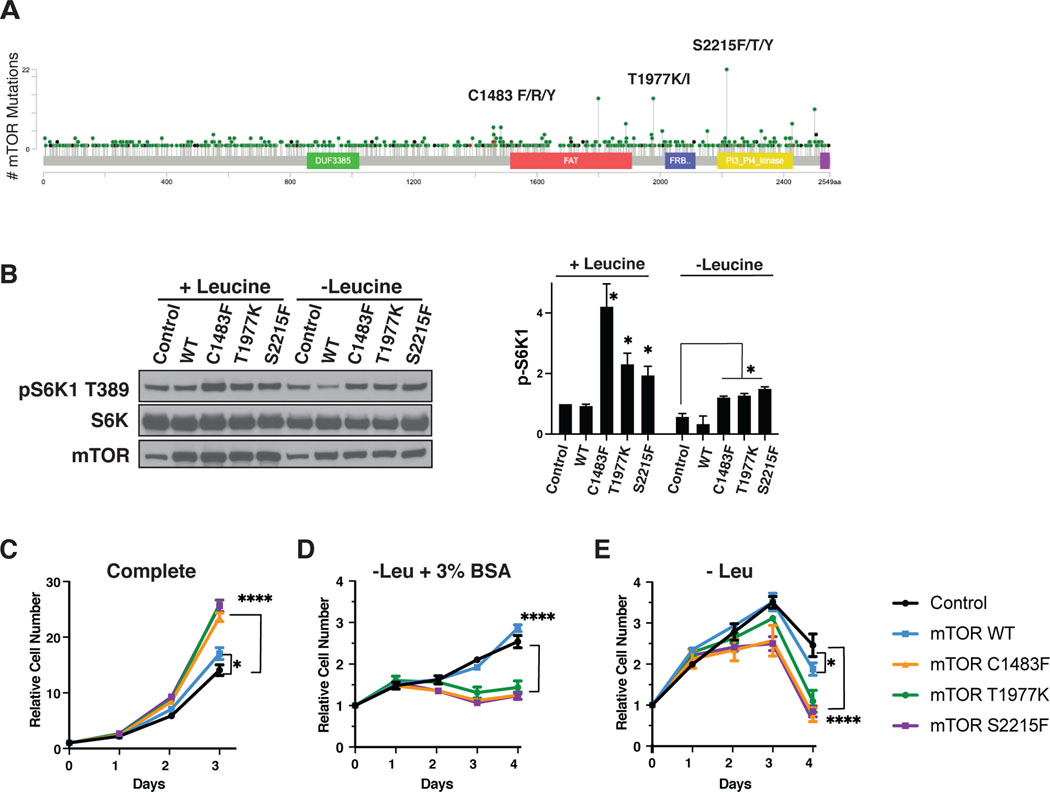
Figure 2: Activating mTOR mutations inhibit growth dependent on exogenous proteins.
A) Lollipop plot of mutations within the mTOR protein. S2215F/T/Y, T1977K/I, and C1483F/R/Y, three clinically validated activating mTOR hotspot mutations used in subsequent in vitro experiments are labeled. B) Western blot of KrasG12D MEFs with either control mTOR (empty vector), or expressing mTOR WT or hyperactivating mutants cultured in complete or leucine deficient medium for 16 hrs, paired with quantification of pS6K1 protein expression. This is a representative blot from three independent experiments. Growth curves with KrasG12D mutant MEFs expressing control (empty vector), mTOR WT or hyperactivating mutants in C) complete medium, D) medium without leucine supplemented with 3% bovine serum albumin (BSA), and E) in medium without leucine. The cell number at indicated days relative to the number at the start of the treatment (d0) is shown. Results are representative of three independent experiments performed in triplicate and are expressed as mean ± SD (error bars) of three replicates. Statistical significance is based on one-way ANOVA. p values are as indicated: ns = not significant; * , p ≤ 0.05; **, p ≤ 0.01; ***, p ≤ 0.001; ****, p ≤ 0.0001.

