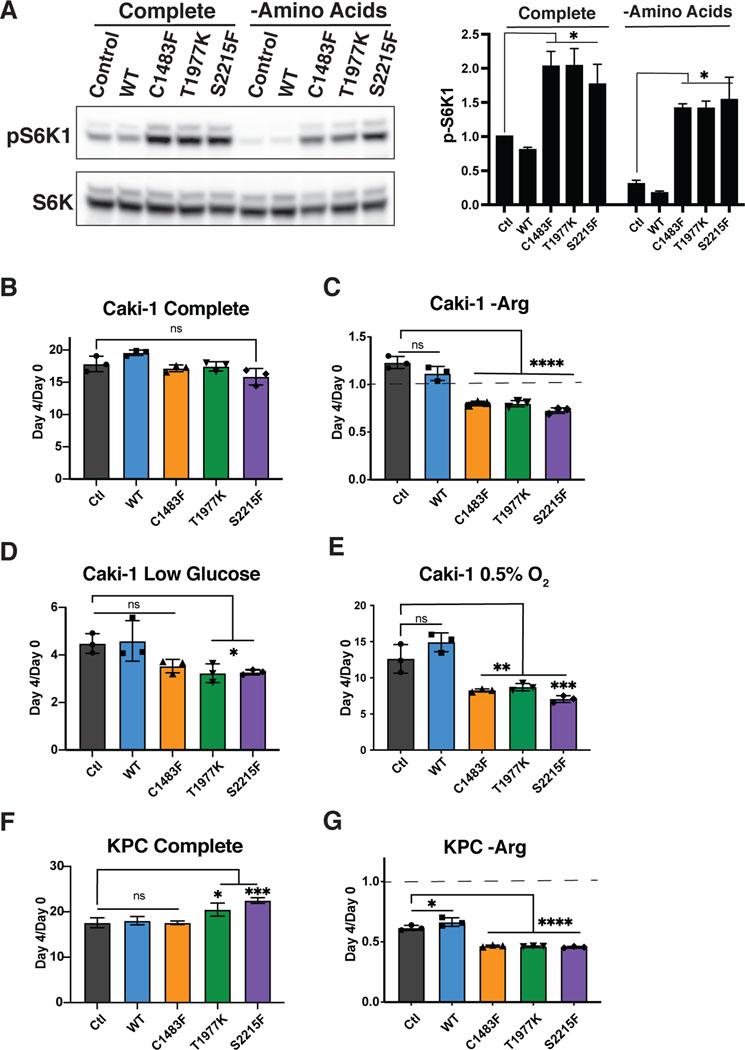
Figure 5: The detrimental effects of activating mTOR mutations are cell type agnostic.
A) Western blot of Caki-1 cells expressing control mTOR (empty vector), mTOR WT, or mTOR mutants grown in complete media or media deprived of all amino acids for 30 minutes, with graph representing protein quantification of pS6K1. Results are representative of at least three independent experiments. Relative cell number of Caki-1 cells expressing empty vector (control) or expressing mTOR WT or mTOR mutants treated with the following conditions: B) complete, C) arginine deficient D) 1mM Glucose, E) 0.5% O2, expressed as mean ± SE (error bars). Statistical significance is based on one-way ANOVA as indicated; *, p ≤ 0.05. Cell numbers at day 4 relative to the number at the start of treatment (d0) are shown. Relative cell number of KPC cells expressing empty vector (control) or expressing mTOR WT or mTOR mutants in F) complete or G) minus arginine medium. The cell numbers at day 4 relative to the number at the start of treatment (d0) are shown. The dotted line in Figures C and G represents cell number at the start of treatment. Results are representative of at least two independent experiments performed in triplicate and are expressed as mean ± SD (error bars) of three replicates. Statistical significance is based on one-way ANOVA. p values are as indicated: ns = not significant; * , p ≤ 0.05; **, p ≤ 0.01; ***, p ≤ 0.001; ****, p ≤ 0.0001.

