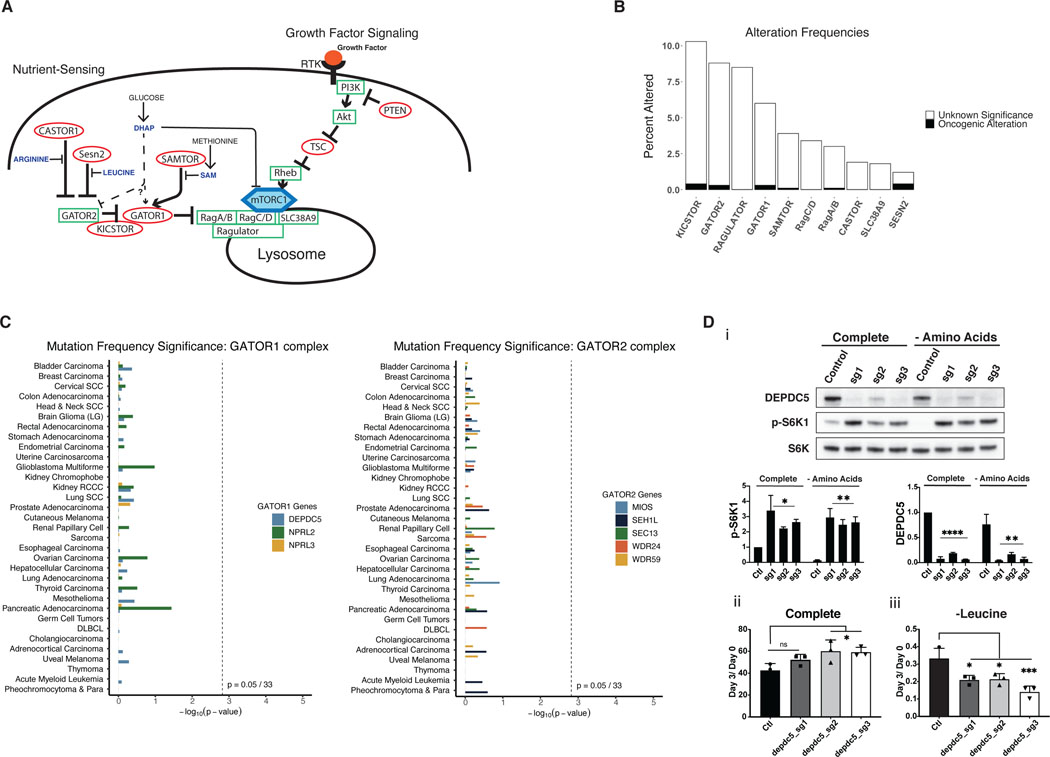
Figure 6: Mutations in the nutrient-sensing arm of mTORC1 are rare and not significantly mutated in cancers.
A) Model of both growth factor signaling and nutrient sensing arms of the mTORC1 pathway. The nutrient sensing arm inactivates mTORC1 via GATOR1/2 if nutrients are limited, even in the presence of growth factor signaling. B) Mutational frequency of genes within the nutrient-sensing arm of the mTORC1 pathway in the TCGA pan-cancer dataset. KICSTOR includes C12ORF66, ITFG2, KPTN, and SZT2. GATOR2 includes MIOS, SEH1L, SEC13, WDR24, and WDR59. RAGULATOR includes LAMTOR1, LAMTOR2, LAMTOR3, LAMTOR4, LAMTOR5. GATOR1 includes DEPDC5, NPRL2, and NPRL3. CASTOR includes CASTOR1 and CASTOR2. C) MutSigCV analysis of GATOR1 and GATOR2 genes, shown as p-values for mutational frequency significance of each gene within each TCGA cancer study. D) i) Western blot of control MEFs or DEPDC5 CRISPR KO MEFs treated with complete or amino acid deficient medium for 30 minutes, paired with quantification of pS6K1 and DEPDC5 protein expression. This is a representative blot from three independent experiments. Relative cell number of MEFs, control or with DEPDC5 CRISPR KO in ii) complete medium and iii) amino acid deficient medium. The cell numbers at day 3 relative to the number at the start of treatment (d0) are shown. Results are representative of at least two independent experiments performed in triplicate and are expressed as mean ± SD (error bars) of three replicates. Statistical significance is based on one-way ANOVA. p values are as indicated: ns = not significant; * , p ≤ 0.05; **, p ≤ 0.01; ***, p ≤ 0.001; ****, p ≤ 0.0001.

