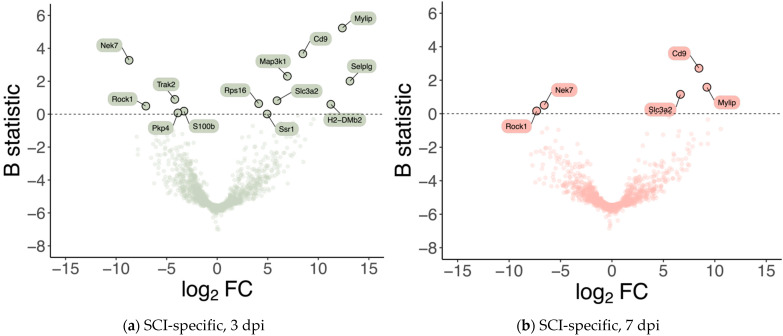
Figure 2.
Spinal cord injury is associated with differences in the expression levels of a small subset of genes at 3- and 7-days post-injury. Volcano plots showing the effect size (in log2 fold-change; X-axis) and the significance (in B statistic, i.e., the log-odds ratio of differential expression; Y-axis) of differential gene expression specifically resulting from spinal cord injury (SCI) in (a) 3 and (b) 7 days post-injury (dpi) samples. Each point indicates one of the 1266 genes considered in the analysis.

