Figure 8.
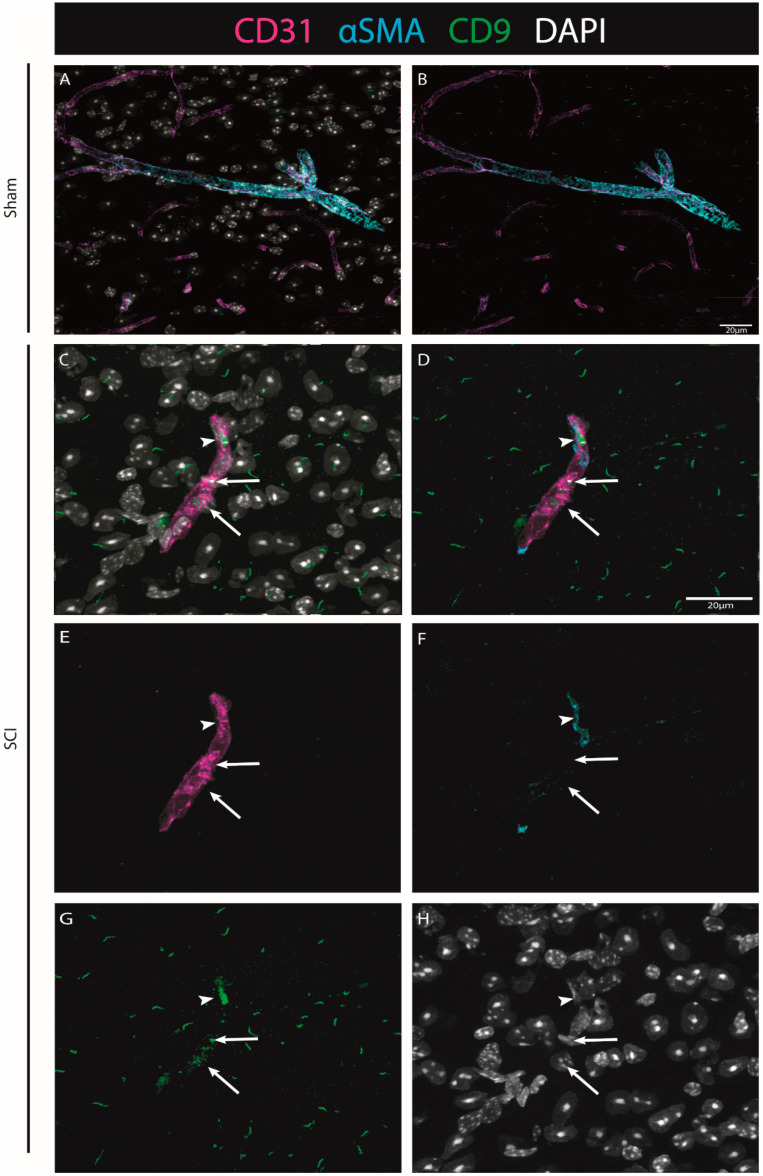
The injury-induced expression of CD9 is detected in close proximity to vascular and perivascular cells. Representative images of sham (A,B) and injured spinal cords (C–H) demonstrate that when CD9 (green) is induced after injury, it is detected in close proximity to both endothelial marker CD31 (magenta, arrows) and pericytic marker αSMA (cyan, arrowhead) at 7 dpi (n = 3). DAPI in grey. Scale bar: 20 µm; 40× amplification.

