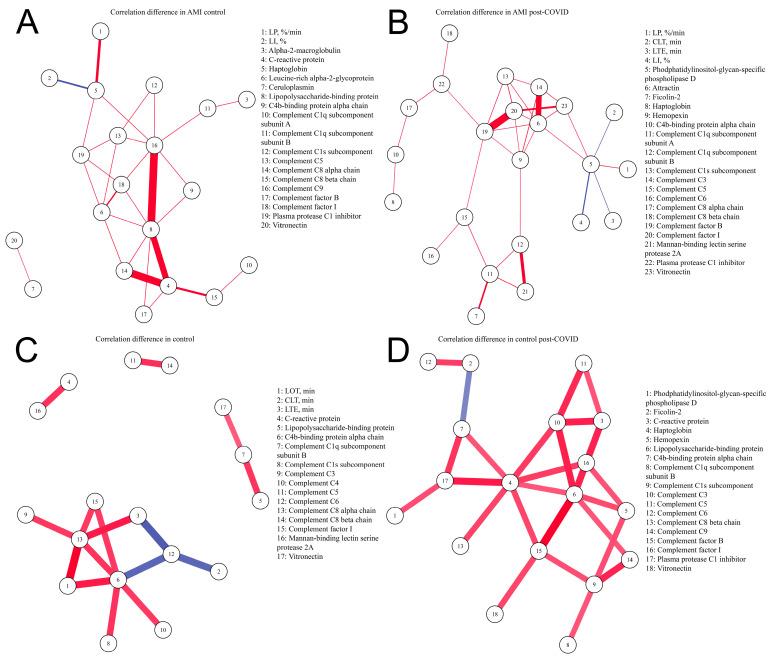
Figure 2.
Differences in correlations between parameters of fibrinolysis, proteins involved in inflammation and components of the complement system. Differences in partial correlations were inferred on the basis of p adj. < 0.05, a magnitude of a Spearman’s correlation coefficient of at least 0.4, and a Spearman’s correlation coefficient > 0.5 or <−0.5. In each group, we calculated the correlation coefficients between the parameters, and then compared the obtained coefficients between the groups. If there is a statistically significant correlation (p adj. < 0.05) between the parameters in both groups, and if the correlation coefficients differ by more than 0.4, then such a correlation will be displayed in the figure between the correlating parameters. Red—positive correlation, blue—negative correlation. Line thickness depends on the Spearman’s correlation coefficient. Parameters of thrombodynamics: LOT—lysis onset time (min), LP—the rate of lysis progression (%/min), CLT—the clot lysis time (min), LI—percent of remaining clot density (%), LTE—the expected clot lysis time (min). (A) Correlations present in the AMI control group and absent in the AMI post-COVID group; (B) correlations present in the AMI post-COVID group and absent in the AMI control group; (C) correlations present in the control group and absent in the control post-COVID group; (D) correlations present in control post-COVID group and absent in the control group.

