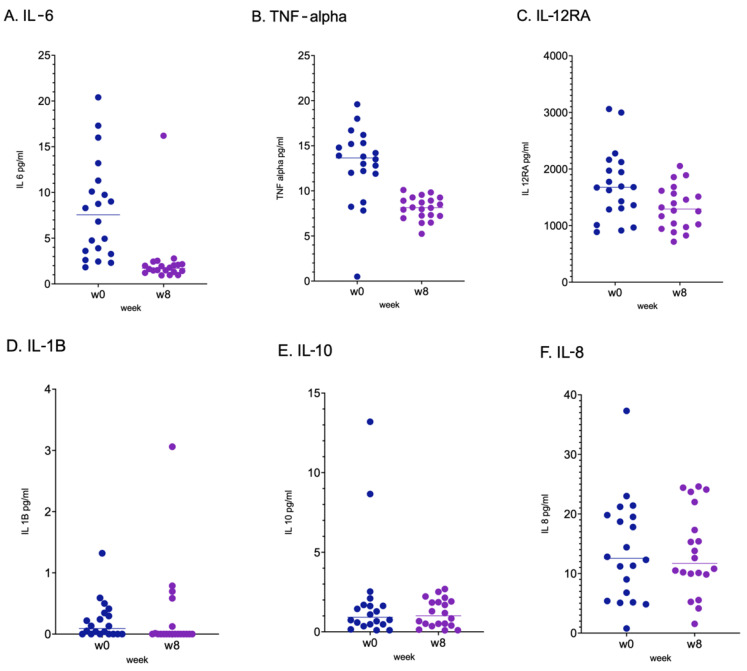
Figure 1.
Values of cytokines detected at baseline (Week 0, W0) and at the end of the study (Week 8, W8). p values for IL-6 (A), TNF-α (B) and IL-12RA (C) were p < 0.001 and p < 0.02, respectively. p values for IL-1B (D), IL-10 (E) and IL-8 (F) were not significant. Paired data were compared by Wilcoxon test after verification of non normal distribution by graphical qqplot representation. The comparisons are reported at T0 (Week 0, w0) and T1 (Week 8, w8), respectively.

