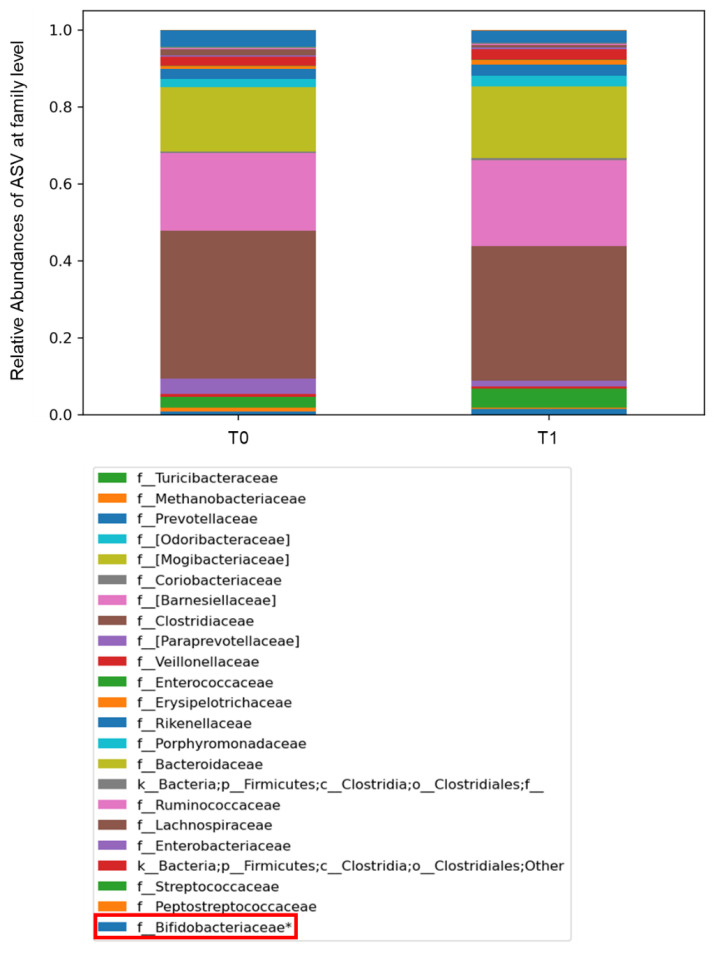
Figure 3.
Histograms representing the relative abundancies of Amplicon Sequence Variant (ASV) distributions in the gut microbiota of patients at T0 and T1, represented at taxonomic family level (L5). The bacterial families were compared by Kruskal–Wallis test. The box in red refers to the family Bifidobacteriaceae, relevant for the composition of the administered probiotic, including Bifidobacterium, and filtered by statistical significance (* p value < 0.001).

