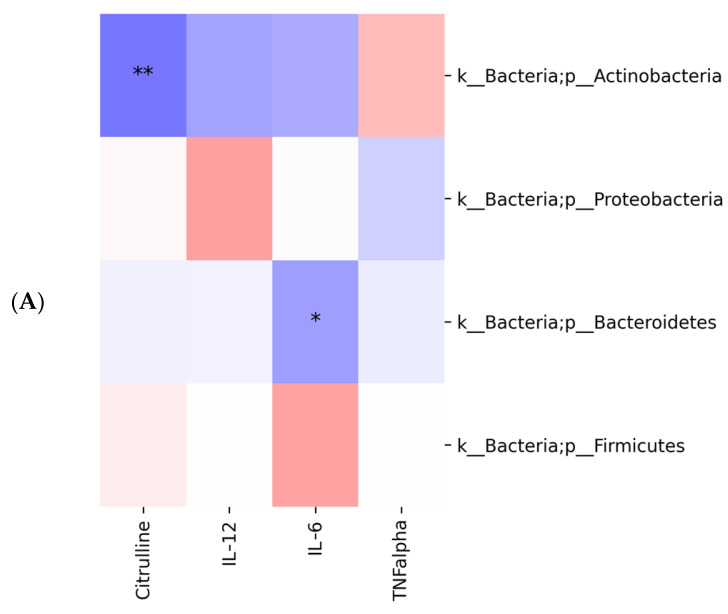
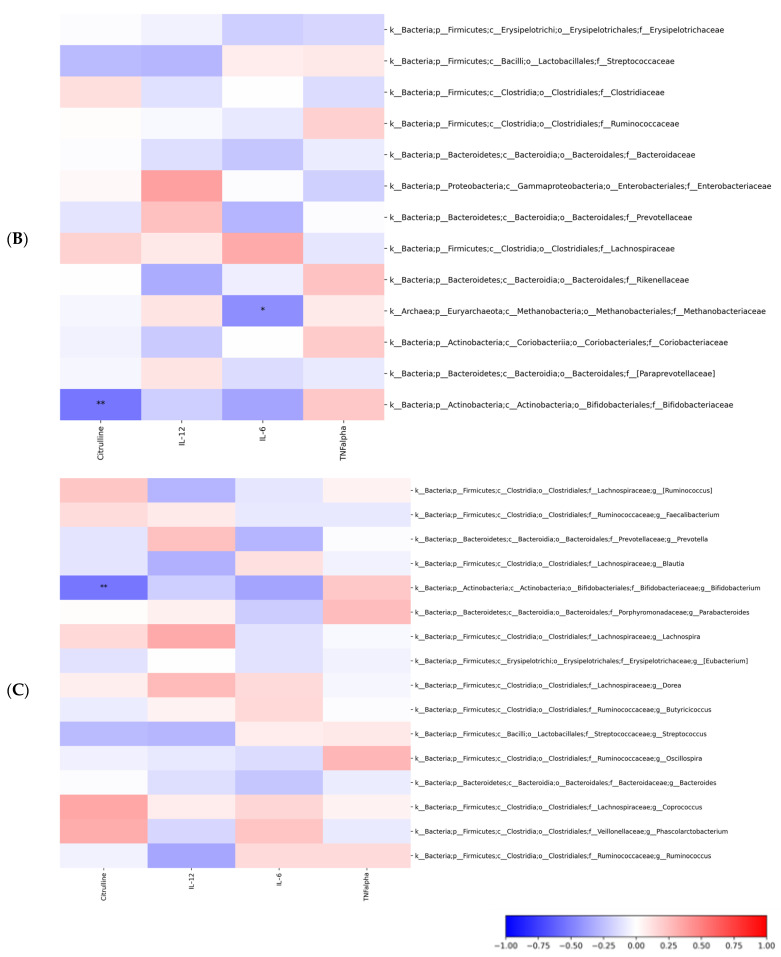
Figure 7.
Spearman’s correlation between citrulline, IL-12, IL-6, TNF-a and ASV. Spearman’s correlation is represented at L2-phylum (A), L5-family (B) and L6-genus (C) levels (FDR adjusted p values < 0.05). The statistical significance is represented with * for p-value < 0.05, and ** for p-value < 0.01.


