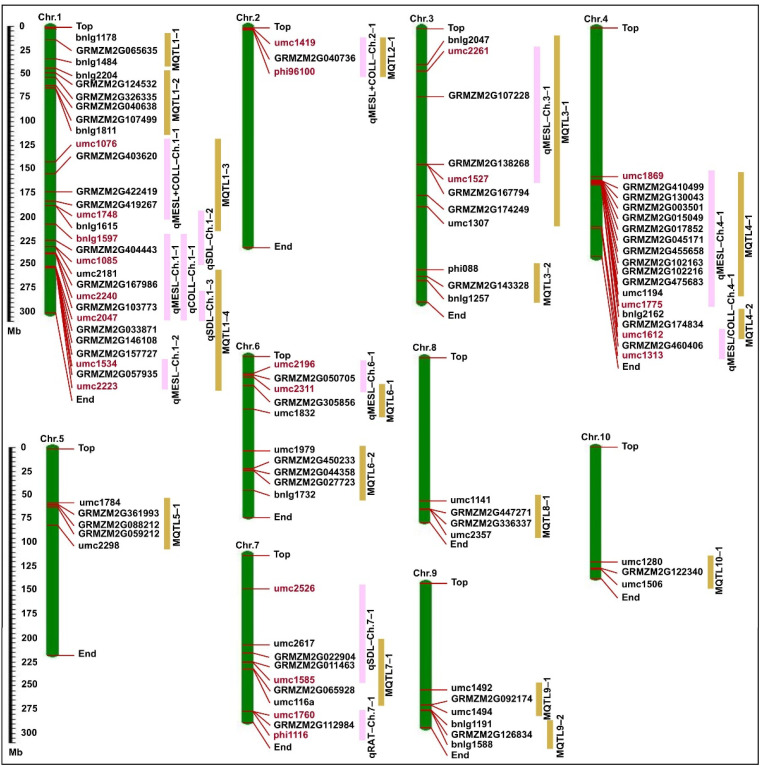
Figure 5.
The physical map was constructed according to B73 RefGen_v3 physical map (https://www.maizegdb.org/genome/assembly/B73%20RefGen_v3; accessed on 10 December 2022); the distributions of major QTLs, meta-QTLs (MQTLs), and candidate genes in the physical map were performed using MapInspect 1.0 software (https://mapinspect.software.informer.com; accessed on 13 December 2022). Pink pillars represent corresponding major QTLs regions in our F2:3 population (vermilion markers represent the two side markers of corresponding major QTLs), and earthy yellow pillars represent MQTLs regions.

