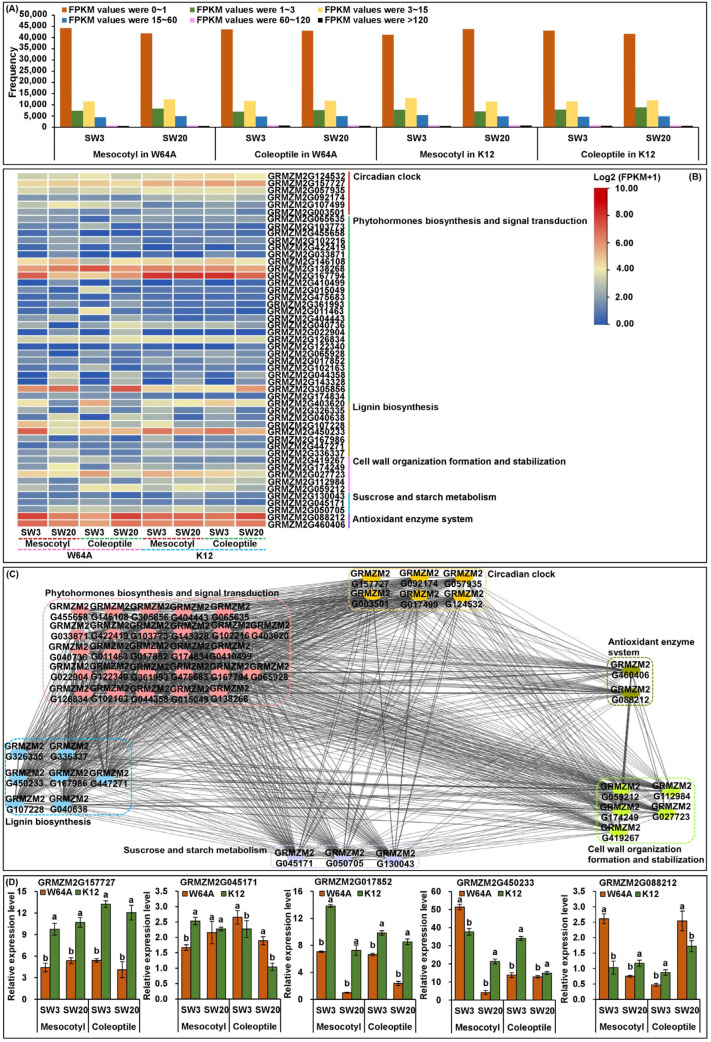
Figure 6.
Gene expressions as the fragments per kilobase of transcript per million mapped read (FPKM) values in mesocotyl and coleoptile of both parents (W64A and K12) at 3 cm (SW3) and 20 cm (SW20) sowing depths via RNA-sequencing (RNA-Seq) (A). The expression profiles of candidate genes in mesocotyl and coleoptile of both parents that were performed using TBtools software (https://github.com/CJ-Chen/TBtools/releases; accessed on 21 December 2022) (B). The interactome networks among all candidate genes were constructed using Cytoscape 3.8.2 (https://cytoscape.org/download.html; accessed on 26 December 2022) (C). Relative expression level of five candidate genes in mesocotyl and coleoptile of both parents at SW3 and SW20 sowing environments, and different lowercase letters over mesocotyl or coleoptile of both parents at a single environment indicate significant differences at p < 0.05 (ANOVA) (D).

