Figure 2.
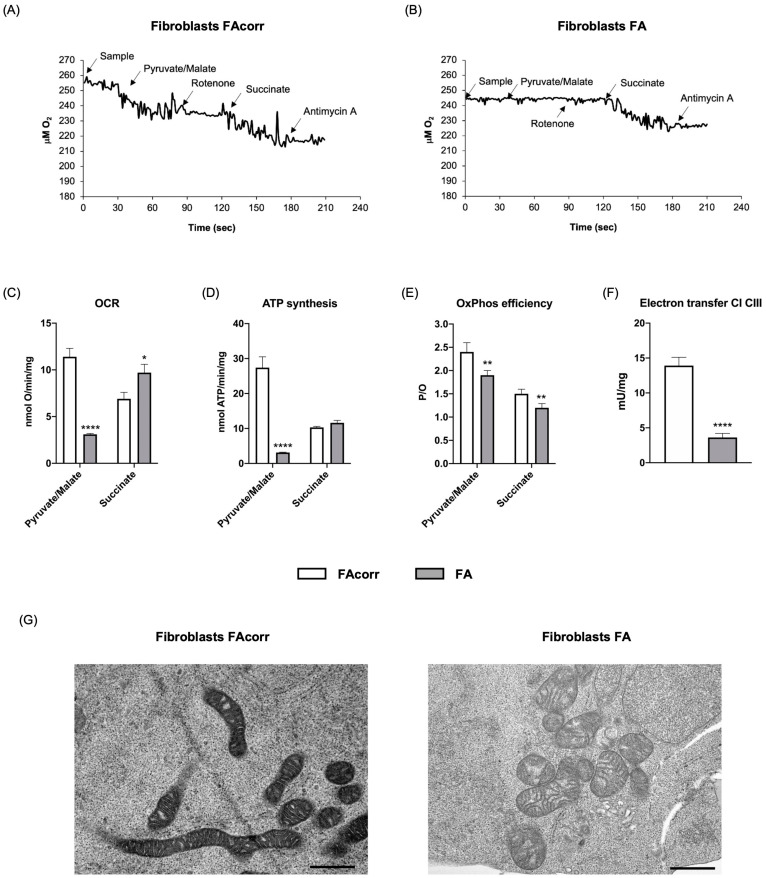
Aerobic metabolism in fibroblasts mutated for the FANC-A gene. Oximetric traces of FAcorr (A) and FA (B) fibroblasts. Arrows indicate the respiratory substrates or inhibitors’ addition. (C) Oxygen consumption rate (OCR). (D) Aerobic ATP synthesis. (E) P/O ratio, representing an OxPhos efficiency marker. (F) Electron transfer between respiratory complexes I and III. (G) Representative electron microscopy imaging of FAcorr and FA fibroblasts to evaluate the mitochondrial morphology. Black scale bars correspond to 1 µm. Data reported in Panels A-E were obtained using pyruvate/malate or succinate as respiring substrates. Data are reported as mean ± SD, and each panel is representative of at least three independent experiments. Statistical significance was tested opportunely with an unpaired t-test or one-way ANOVA; *, **, and **** represent a significant difference for p < 0.05, 0.01, or 0.0001, respectively, between FA and FAcorr cells.

