Figure 2.
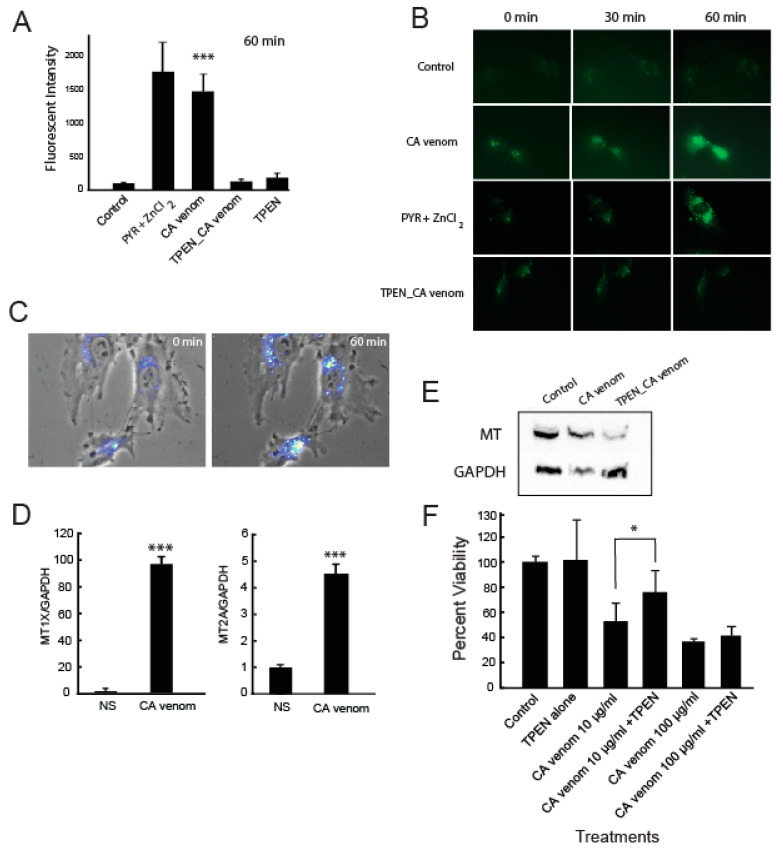
Zinc trafficking in HUVEC during CA venom stimulation. (A) Fluorescent microscopy analysis. Cells were stimulated with CA venom, pyrithione-zinc, TPEN_CA venom or TPEN alone for 1 h. *** p < 0.001 vs. non-stimulated control (n = 10–15 cells per experimental group). (B) Representative fluorescent micrograph time course of HUVEC loaded with FluoZin-3AM treated with PYR/ZnCl2, TPEN (preincubation) then CA venom or CA venom alone (400×). (C) Phase contrast and fluozin-3AM fluorescent composite micrographs of HUVEC stimulated with CA venom after 60 min period. (D) qPCR of MT1X and MT2A gene expression after 3 h stimulation with CA venom *** p < 0.001 (n = 3). (E) Western blot. Metallothionein (MT) protein expression stimulated with CA venom or TPEN (preincubated) then CA venom for 8 h. (F) MTS cytotoxicity assay. Cell treated with CA venom alone (10 and 100 μg/mL), TPEN alone 3 µM or pretreated with 3 μM TPEN, then stimulated with CA venom (10 or 100 μg/mL) or 3 h. * p < 0.05 vs. CA venom 10 μg/mL.

