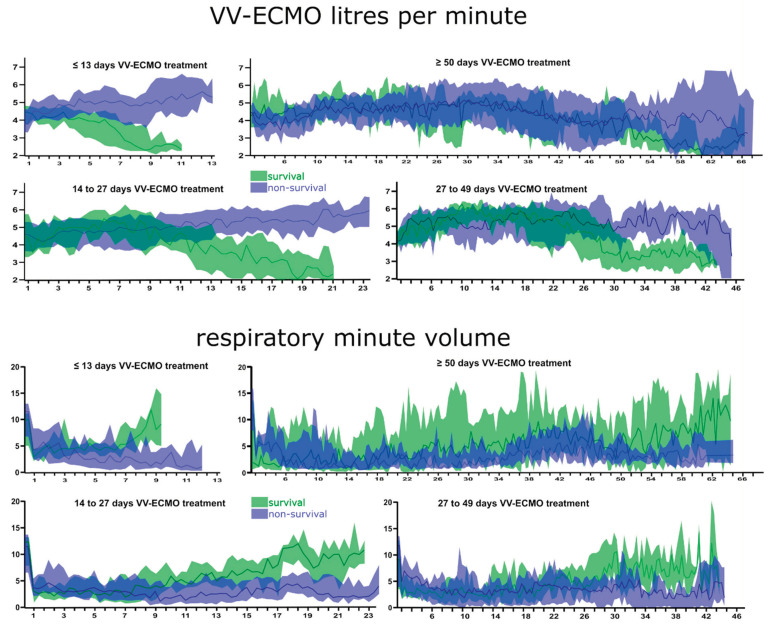
Figure 3.
ECMO flow and respiratory minute volume over time separated by survival and grouped by treatment duration. Graphical visualization of the blood flow rates during VV-ECMO therapy and the respiratory minute volume over the course of the treatment days as median, including the corresponding interquantile range as coloured area.

