Figure 3.
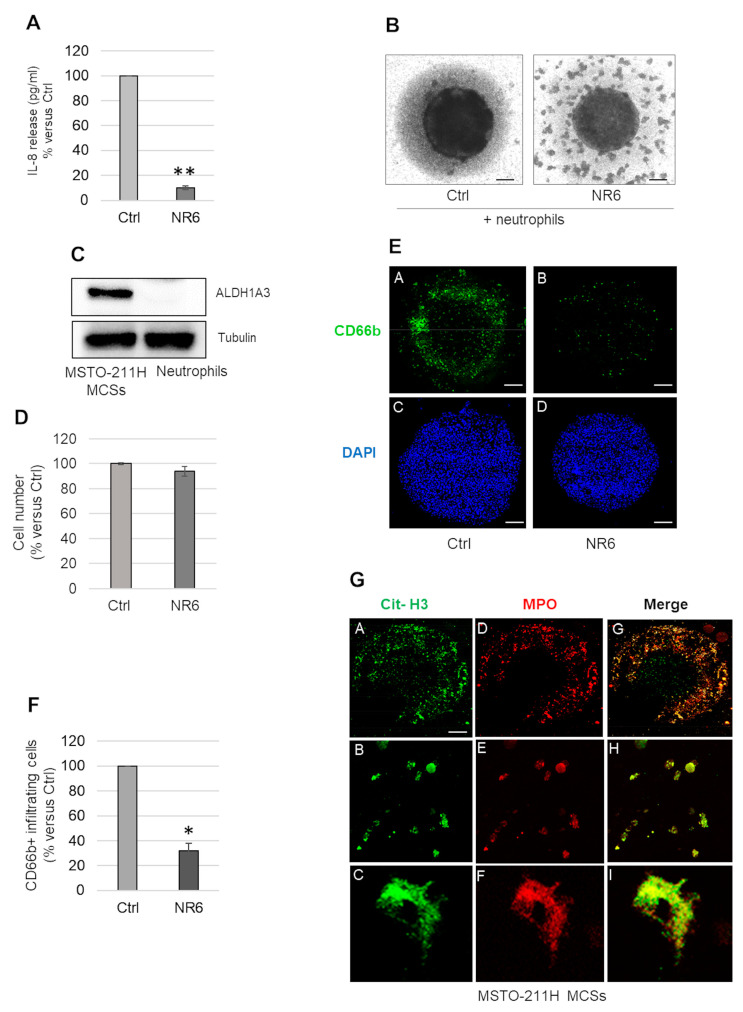
Effects of NR6 treatment on neutrophil recruitment ability of MSTO-211H MCSs. (A) Bar graph shows the IL-8 level (pg/mL) released in the medium by NR6-treated (72 h) MSTO-211H MCSs expressed as percentage versus untreated control MCSs (Ctrl). (B) Representative phase contrast images of MSTO-211H MCSs treated or not with NR6, for 48 h, and then co-cultured with neutrophils for an additional 24 h. Scale bar = 100 µm. (C) Representative Western blot analysis of ALDH1A3 expression in neutrophils compared to MSTO-211H MCSs. Tubulin was used as loading control. (D) Bar graph shows the percentage of viable neutrophil upon 24 h of NR6 treatment, expressed as percentage versus untreated controls (Ctrl). (E) Representative confocal images of MSTO-211H MCSs treated or not, 48 h, with NR6 and co-cultured with neutrophils for additional 24 h. Neutrophils were stained with anti-CD66b-FITC antibodies (green) (A,B), nuclei were counterstained with DAPI (blue) (C,D). Scale bar = 200 µm (F). Bar graph shows the percentage versus control of neutrophils infiltrated in MSTO-211H MCSs treated with NR6, evaluated by anti-CD66b-FITC antibodies staining and FACS analysis. (G) Representative confocal images of neutrophils infiltrated in a MSTO-211H MCS, stained with anti-Cit-H3-FITC (green) (A–C) and anti-MPO-PE (red) (D–F) antibodies at 63× magnification (A,D,G). Images were merged (G,H,I) and zoomed (B,C,E,F,H,I). Scale bar = 200 µm. In all graphs reported in Figure 3, each bar represents mean of three independent experiments ± s.d., * p ≤ 0.05, ** p ≤ 0.01.

