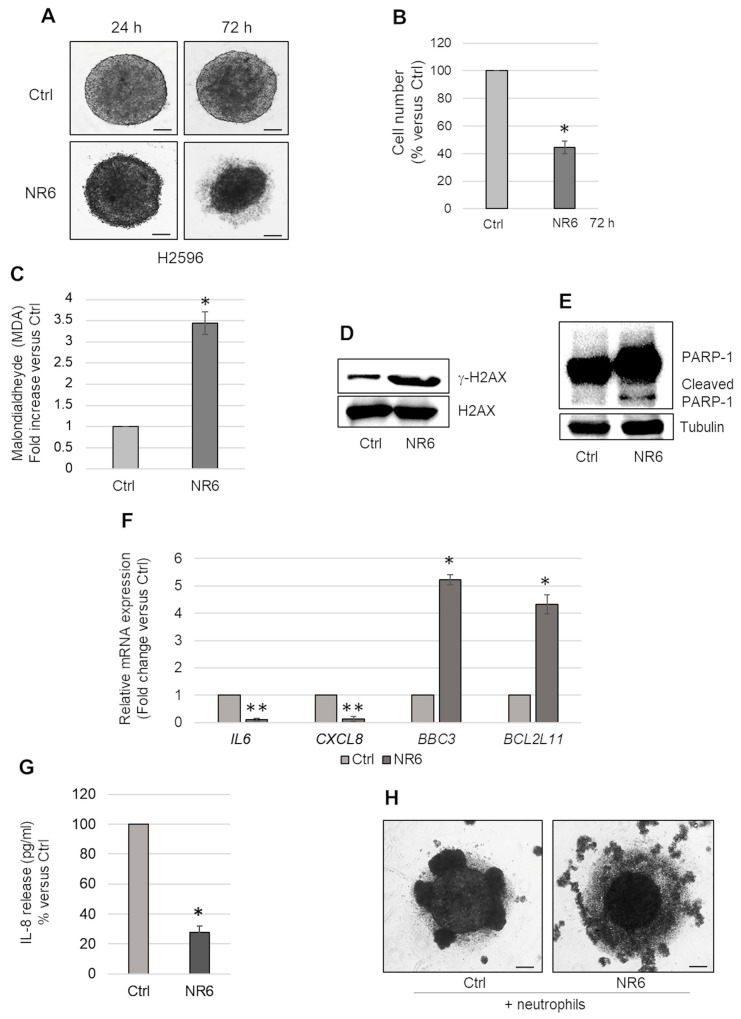
Figure 5.
Effects of NR6 treatment in CDKN2A null H2596 MCSs. (A) Representative phase contrast images of H2596 MCSs treated with NR6, for 24 and 72 h. Scale bar = 100 µm. (B) Bar graph shows the number of viable cells in NR6-treated H2596 MCSs, represented as percentage versus untreated MCSs (Ctrl). (C) Bar graph shows the intracellular level of malondialdheyde (MDA) in NR6-treated H2596 MCSs (NR6) expressed as fold increase versus untreated MCSs (Ctrl). (D) Representative Western blot analysis of γ-H2AX expression in untreated (Ctrl) or NR6-treated H2596 MCSs (NR6). H2AX was used as loading control. (E) Representative Western blot analysis showing PARP-1 expression/cleavage in untreated (Ctrl) or NR6-treated H2596 MCSs. Tubulin was used as loading control. (F) Bar graph shows CDKN2A, IL6, CXCL8, BCL2L11, and BBC3 mRNA expression in NR6-treated H2596 MCSs (NR6) evaluated by real time-PCR and expressed as fold changes versus untreated control MCSs (Ctrl). 18S rRNA was used as housekeeping gene. (G) Bar graph shows the levels (pg/mL) of IL-8 released in the medium by H2596 MCSs treated with NR6, expressed as percentage versus untreated MCSs (Ctrl). (H) Representative phase contrast images of H2596 MCSs treated or not with NR6, for 48 h, and then co-cultured with neutrophils for additional 24 h. Scale bar = 100 µm. In all graphs reported in Figure 5, each bar represents mean of three independent experiments ± s.d., * p ≤ 0.05, ** p ≤ 0.01.

