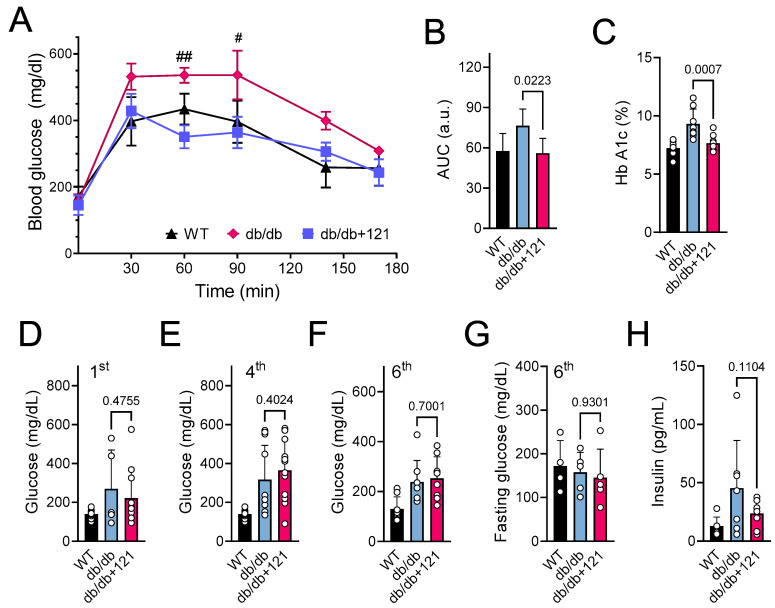
Figure 2.
Glucose status in db/db mice that were untreated or treated with CMS121 for 6 months. (A) Glucose tolerance test (GTT, n = 4–5) and (B) area under the curve (AUC) were obtained at the 6th month of treatment. (C) At the end of the experiment, blood was collected for the measurement of hemoglobin A1c (HbA1c; n = 8–9). Glucose was evaluated by caudal vein puncture (n = 11–12) after the 1st (D), 4th (E), and 6th ((F), n = 8) month of treatment. Fasting glucose was also evaluated in animals at 6 months of treatment ((G), n = 4–5). (H) Insulin levels were evaluated at the end of the treatment (n = 6–8). Data are presented as mean ± SD, except for GTT (mean ± SEM). p-values are indicated for the untreated control db/db mice compared to the CMS121-treated mice. Values of WT mice are presented as a reference. For the GTT (A), two-way ANOVA was used followed by the Bonferroni post-hoc test for multiple comparison analysis. One-way ANOVA was used to detect mean changes, and differences between db/db and db/db + 121 were evaluated by the Holm–Sidak post-hoc test (B–H). # p < 0.05 and ## p < 0.01 as compared to WT at the same timepoint.

