Figure 5.
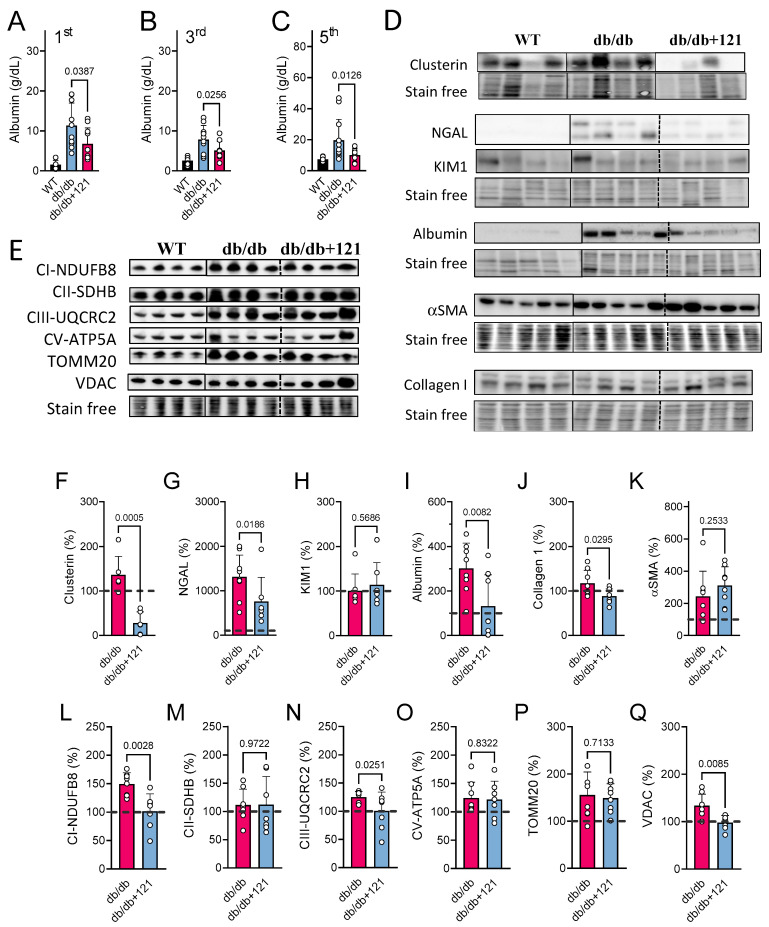
Kidney markers were evaluated in db/db mice fed with CMS121. Urinary albumin levels (A–C) were evaluated at the 1st, 3rd, and 5th treatment months. Values of control mice (WT) are presented as a reference. Representative blot images of kidney damage markers are presented (D) along their respective quantifications: (F) clusterin; (G) NGAL; (H) KIM1; (I) albumin, (J) collagen; (K) α-smooth muscle actin (αSMA). Data are presented as mean ± SD (n = 8–12). Representative blot image (E) of kidney mitochondrial proteins and their respective quantifications: markers of mitochondrial complex I ((L); NDUFB8), complex II ((M); SDHB), complex III ((N); UQCRC2), and complex V ((O); ATP5A), as well as the outer membrane translocase TOMM20 (P), and the voltage-dependent anion channel VDAC (Q). Vertical lines indicate non-adjacent lanes from the same blot, and dashed lines adjacent groups. Data are presented as mean ± SD (n = 6–8). p-values are indicated for the untreated db/db mice as compared to the CMS121-treated mice. Values were normalized to WT group (dashed line), and data are presented as percentages of WT values. One-way ANOVA was used to detect mean changes, and differences between db/db and db/db + 121 were evaluated by the Holm–Sidak post-hoc test.

