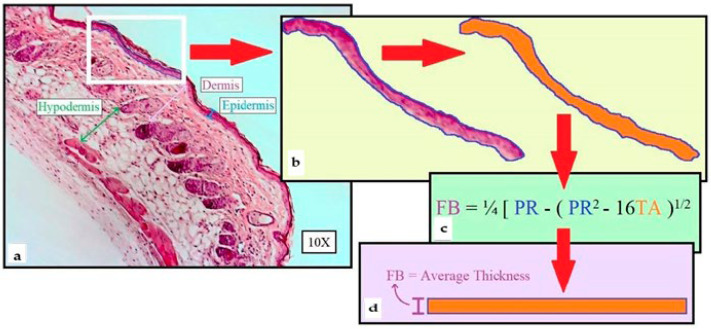
Figure 1.
Flow chart for computer-assisted measurements of skin layer thickness: (a) H&E-stained whole skin section, showing individual layer thickness: epidermis (blue), dermis (purple), hypodermis (green), and Region of Interest (ROI, white rectangle) used to survey each full-length layer. (b) Epidermis isolation within the ROI converted into a Traced Area (TA, orange). (c) Equation used to calculate layer thickness (FB, Fiber Breadth) using measured perimeter of the isolated layer (PR, μm) and TA (μm2). (d) Resulting conversion of the irregular fiber (b) into a rectangle measuring the average thickness of the layer while preserving its original length-to-width ratio.

