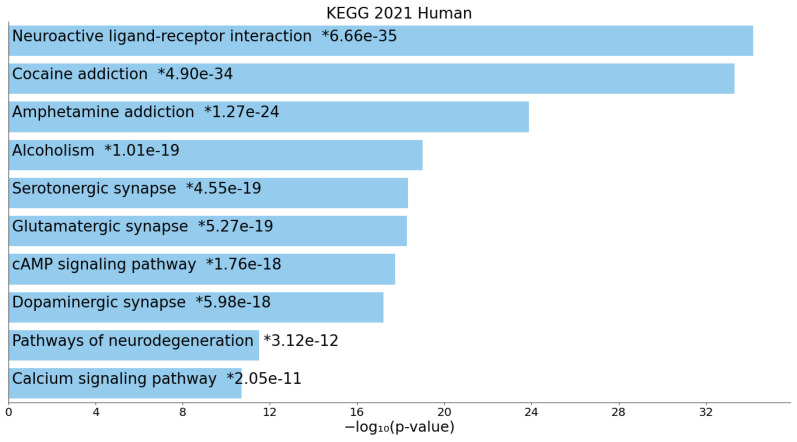
Figure 2.
Bar chart of top enriched terms from the KEGG_2021_Human gene set library. The top 10 enriched terms for the input gene set are displayed based on the -log10 (p-value), with the actual p-value shown next to each term (*). The term at the top has the most significant overlap with the input query gene set.

