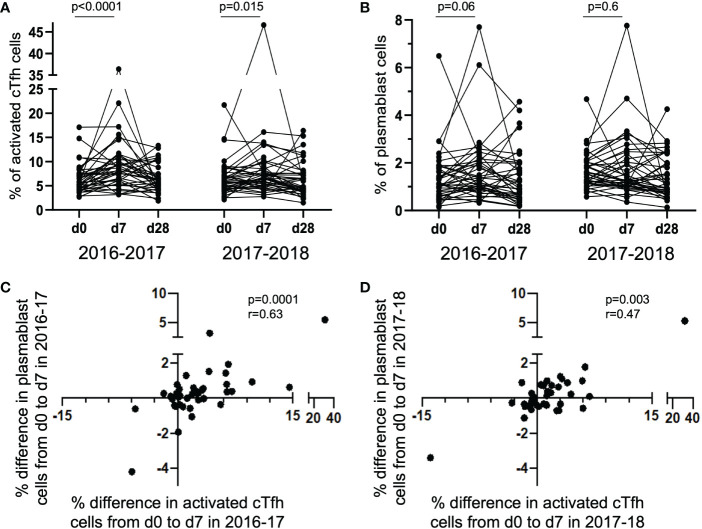
Figure 1.
Activated cTfh and plasmablast cells increase from d0 to d7 with the magnitude of responses correlated between the cell types. The percentage of activated cTfh cells significantly increased at d7 following vaccination in the 2016-17 and 2017-18 seasons [(A) paired t-test], but only a trend was observed for plasmablast cells in the 2016-17 season [(B); paired t-test]. The magnitude of cTfh activation and circulating plasmablast frequency is significantly positively correlated in both the 2016-17 [(C); p < 0.0001; rs = 0.63; Spearman Rank test] and 2017-18 [(D); p = 0.003; rs = 0.47; Spearman Rank test] seasons.

