Figure 6.
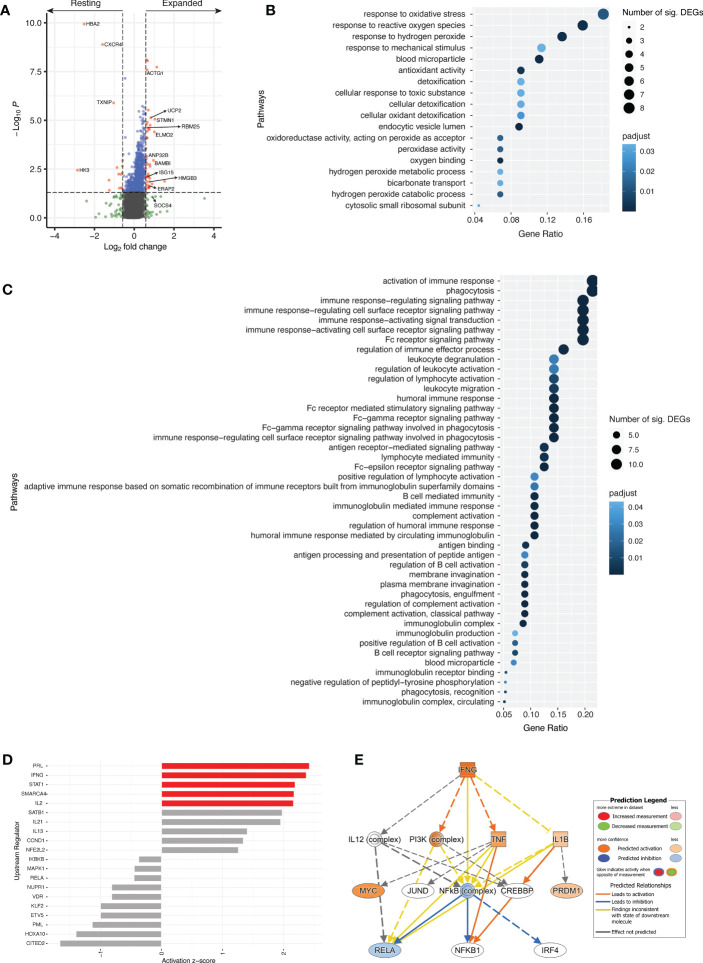
Different transcriptional profile between resting and expanded cTfh cells. (A) Volcano plot comparing resting and expanded cTfh cells for all four subjects at d7. Significant DEGs by both p value and fold change are depicted in red. Horizontal and vertical dotted lines represent a significance threshold of p < 0.05 and a fold change of |1.5|, respectively. Significantly upregulated GO pathways for (B) resting and (C) expanded cTfh cells. Both the number of significant DEGs within each pathway and the p adjusted value are plotted. (D) Top 10 upstream regulators identified using DEGs for both resting (negative) and expanded (positive) cTfh cells, with pathways demonstrating significant alteration (z-score > |2|) depicted in red. (E) Mechanistic network for IFNG and their activation state in expanded cTfh cells based on ingenuity pathway analysis.

