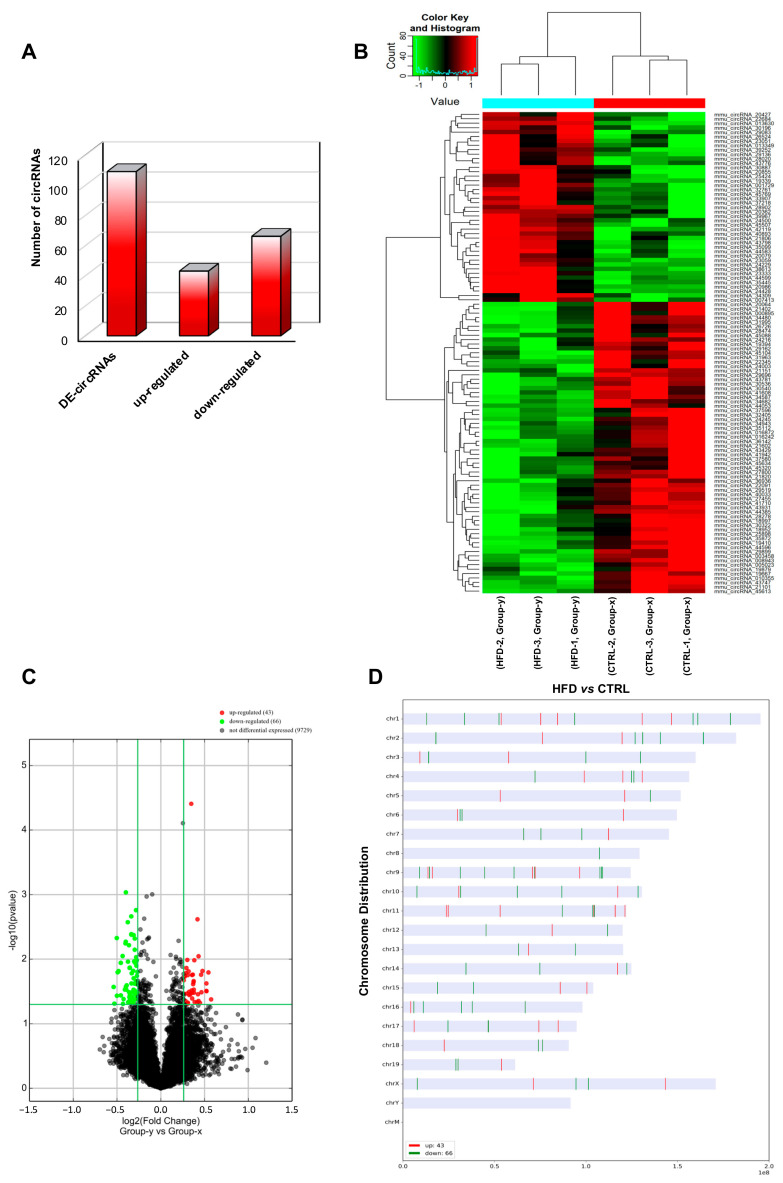
Figure 3.
Differential expression of circRNAs between CTRL and HFD SPZ. (A) The distribution of up- and downregulated DE-circRNAs, among a total of 109 DE-circRNAs, in HFD compared with CTRL SPZ. (B) Hierarchical clustering analysis of DE-circRNAs in CTRL SPZ (samples CTRL-1, CTRL-2, CTRL-3) and HFD SPZ (samples HFD-1, HFD-2, HFD-3); the expression values (fold change > 1.5, p < 0.05) were represented in different colors, indicating expression levels above and below the median expression level across all samples. (C) The volcano plot was constructed using fold change and p-values; in detail, the values on X and Y axes are log2 (FC = fold change) and –log10 (p-values), respectively. Red points in the volcano plot represent the DE-circRNAs with statistical significance. (D) The distribution of up- and downregulated DE-circRNAs in the mouse genome, according to their host gene location.

