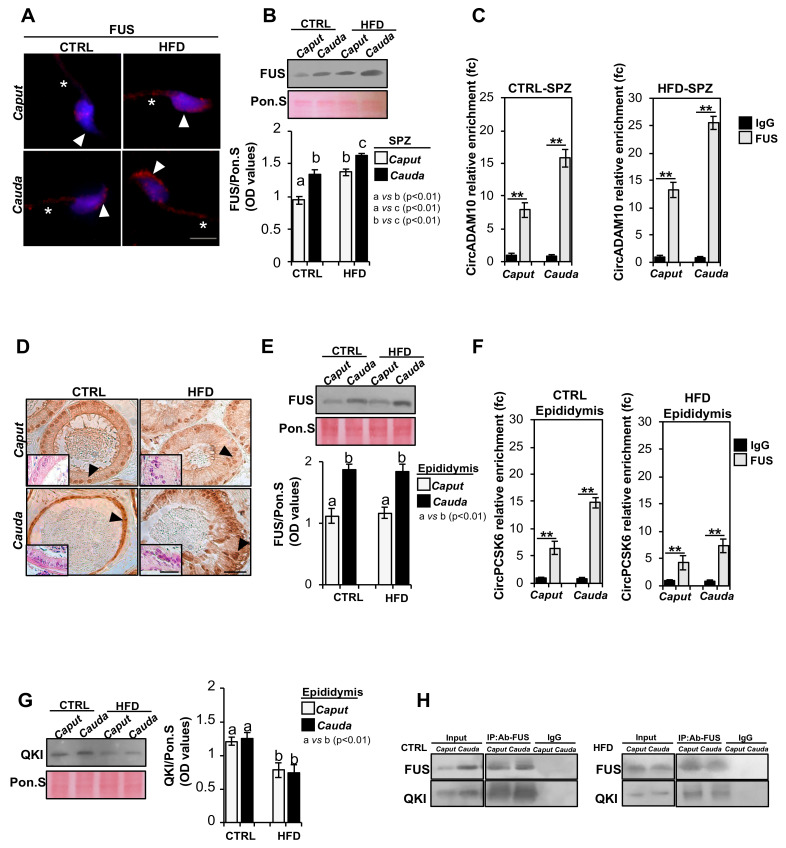
Figure 5.
Characterization of backsplicing machinery in SPZ and epididymis of CTRL and HFD mice. (A) Immunofluorescence analysis of FUS protein in caput and cauda SPZ of CTRL and HFD mice. White arrowheads and white asterisks represent FUS localization (RED) in sperm head and tail, respectively. Nuclei were labeled with DAPI (blue). Scale bar: 5 µm. (B) Western blot analysis of FUS protein (75 KDa) in caput and cauda SPZ of CTRL and HFD mice (n = 5 different samples for each experimental group in triplicate). Signals were quantified by densitometry analysis and normalized to Ponceau Red (Pon.S). Data were expressed in OD values and reported as mean ± SEM. Experimental groups with statistically significant differences (p < 0.01) were indicated with different letters. (C) The enrichment levels of circADAM10 in the products of RIP assay (FUS-IP compared with IgG-IP) in caput and cauda SPZ of CTRL and HFD mice detected by qRT-PCR. Data are reported as mean ± SEM from three independent experiments. ** p < 0.01. (D) Immunocytochemistry of FUS in Bouin’s fixed caput and cauda epididymis sections (7 μm) of CTRL and HFD mice (n = 5 different samples for each experimental group in triplicate). The FUS protein localization in principal cells was indicated by black arrows. Scale bar: 50 μm; inset: H&E staining of Bouin’s fixed caput and cauda epididymis sections (7 μm) of CTRL and HFD mice; scale bar: 20 μm. (E) Western blot analysis of FUS protein in caput and cauda epididymis of CTRL and HFD mice. Signals were quantified by densitometry analysis and normalized to Ponceau Red (Pon.S). Data were expressed in OD values and reported as mean ± SEM. Experimental groups with statistically significant differences (p < 0.01) were indicated with different letters. (F) The enrichment levels of circPCSK6 in the products of RIP assay (FUS-IP compared with IgG-IP) in caput and cauda epididymis of CTRL and HFD mice detected by qRT-PCR. Data are reported as mean ± SEM from three independent experiments. ** p < 0.01. (G) Western blot analysis of QKI protein (40 KDa) in caput and cauda epididymis of CTRL and HFD mice. Signals were quantified by densitometry analysis and normalized to Ponceau Red (Pon.S). Data were expressed in OD values and reported as mean ± SEM. Experimental groups with statistically significant differences (p < 0.01) were indicated with different letters. (H) IP in caput and cauda epididymis of CTRL and HFD mice. Total proteins collected were immunoprecipitated using FUS antibody. Protein interaction between FUS and QKI was detected by Western blot analysis.

