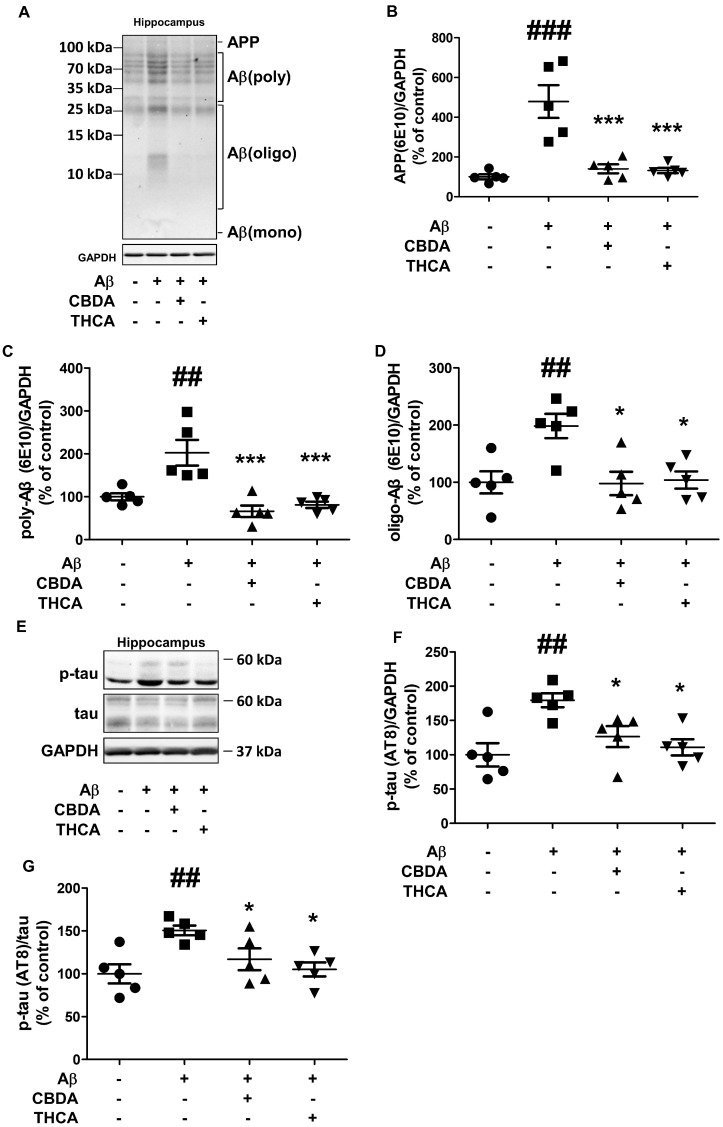
Figure 4.
Effects of CBDA and THCA on hippocampal Aβ and p-tau levels in Aβ1–42-treated mice. (A) Representative Western blots of APP/Aβ proteins. (B–D) Western blot densitometry results for (B) APP, (C) polymeric Aβ, and (D) oligomeric Aβ. (E) Representative Western blots of tau and p-tau (AT8) protein. (F,G) Western blot densitometry results for (F) p-tau (AT8), (G) p-tau (AT8)/tau. (mean ± SEM, ## p < 0.005 and ### p < 0.001 vs. PBS-treated, * p < 0.05 and *** p < 0.001 vs. Aβ1–42-treated, one-way ANOVA followed by Fisher’s LSD; n = 5 per group).

