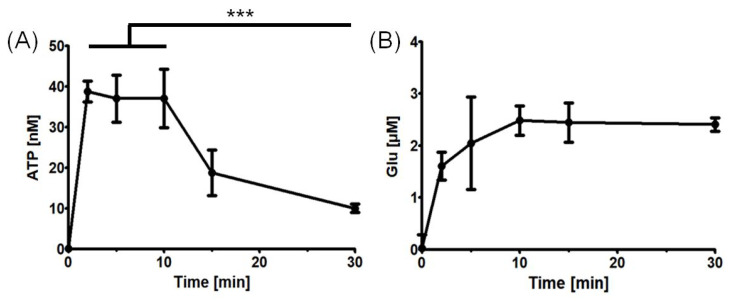
Figure 1.
ATP and Glu release dynamics from the astrocyte cultures. (A) ATP release after cell wash and fresh experimental medium addition at various time points. ATP concentration was found to be significantly reduced at 30 min as compared with at 2–10 min (Welch’s t-test, *** p < 0.001). (B) Glu release after cell wash and HEPES-buffered solution addition at various time points. The points represent the mean estimates, whereas the whiskers indicate the standard errors of means. Number of biological replicates n ≥ 4 for each time point.

