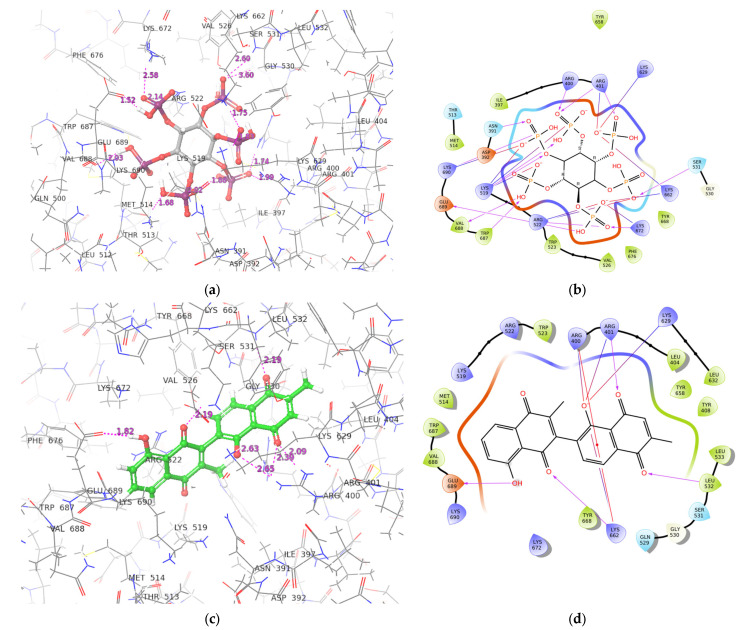
Figure 4.
Conformation and protein–ligand interaction profiles of the binding pose with the most negative binding energy of IHP (a,b) and ZINC000044417732 (c,d). For the interaction profiles, purple arrows, red lines and combination of “red and blue” lines represent hydrogen bonds, pi-cation interactions and salt-brides, respectively.

