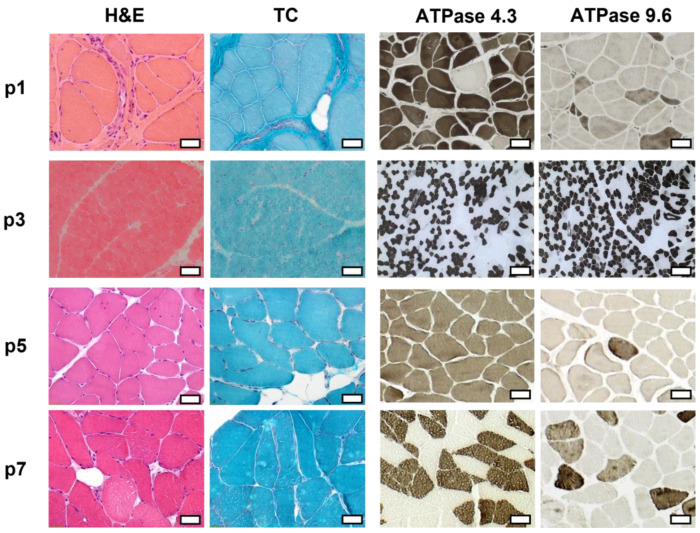
Figure 3.
Histopathologic analysis of the skeletal muscle biopsy of p1, p3, p5, and p7. Hematoxylin-eosine (H&E), Gömöri trichrome (TC), and ATPase stainings 4.3 and 9.6 are displayed. Light microscopic analysis revealed primarily myopathic features, which were most prominent in p1. Scale bar: 50 µm.

