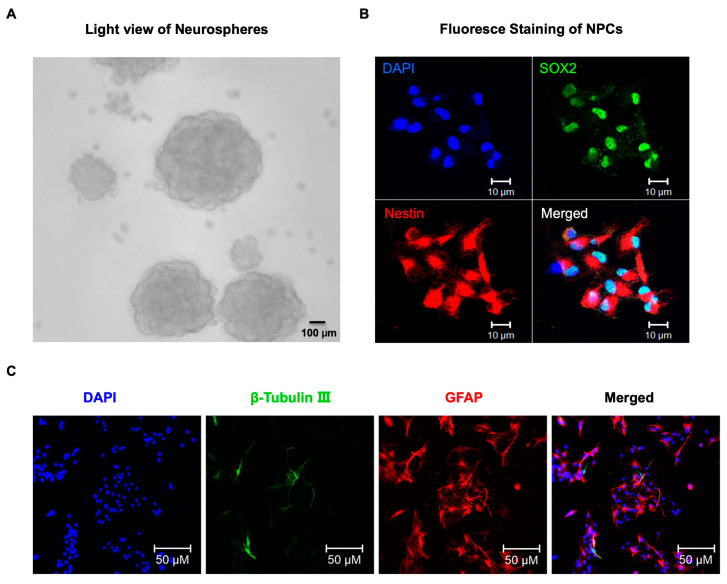
Figure 1.
Identification of neural progenitor cells (NPCs). (A) Light view of NPCs, Scale bar = 100 μm. (B) Immunostaining of NPCs for DNA marker DAPI (blue), the NPCs markers SOX2 (green), and nestin (red). Scale bar = 10 μm. (C) Representative immunofluorescence images of NPCs that differentiate into neurons and astrocytes after 3 day’s differentiation culture. Double immunofluorescent staining of cells for β-tubulin III (neuronal marker, green) and GFAP (astrocyte marker, red). The nuclei are counterstained with DAPI (blue). Scale bars = 50 μm.

