Figure 2.
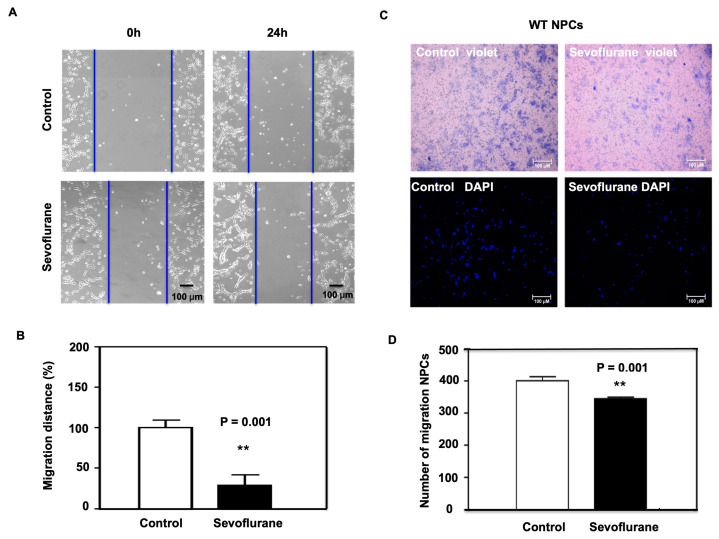
The effects of the sevoflurane treatment on cell migration using wound healing and transwell assays. (A) The bright-field images of the wound healing assay demonstrate cell movement 24 h after the sevoflurane treatment compared to the control condition. The blue line indicates the migration distance relative to the control condition. NPCs were maintained in the incubator between inspections. (B) Quantification of the migration shows that the sevoflurane treatment significantly reduces the migration distance in the wound healing assay compared to the control condition at 24 h after the sevoflurane treatment (** p = 0.001). (C) Transwell assay images of migrated cell stained by crystal violet (top) or DAPI (below) 24 h after the sevoflurane treatment. (D) Quantification of the transwell assay shows that the sevoflurane treatment significantly decreases the number of migrated cells as compared to the control condition (** p = 0.001; N = 10 in each group). Student’s t-test was used to analyze the data.

