Figure 3.
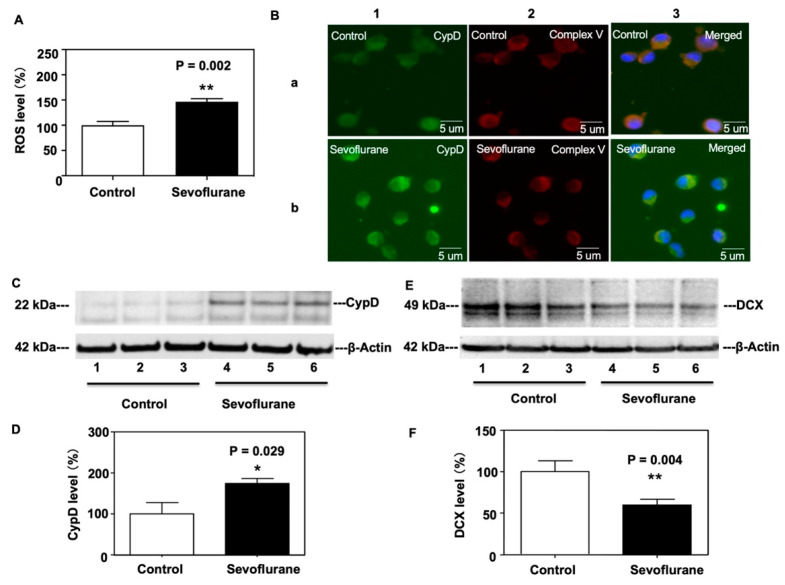
Sevoflurane increases ROS and CypD levels but decreases doublecortin (DCX) levels in NPCs harvested from WT mice. (A) Sevoflurane treatment (black bar) increases the levels of ROS compared to the control condition (white bar). (B) Representative images of immunofluorescent staining of CypD in NPCs harvested from WT mice. Column 1 is the CypD (green) staining, column 2 is the mitochondrial markers Complex V (red) staining, and column 3 is a merged staining image. Sevoflurane (row b) increases levels of CypD compared to the control condition (row a) in NPCs harvested from WT mice. (C) Western blot shows that the sevoflurane treatment (lanes 4 to 6) discernibly increases the levels of CypD compared to the control condition (lanes 1 to 3). There is no significant difference in β-actin levels between the sevoflurane treatment and control condition. (D) Quantitation of the Western blot illustrates increased amounts of CypD levels following the sevoflurane treatment compared to the control condition (* p = 0.029). (E) Sevoflurane treatment (lanes 4 to 6) discernibly decreases doublecortin (DCX) levels compared to the control condition. There is no significant difference in β-actin levels between the sevoflurane treatment and control condition. (F) Quantitation of the Western blot illustrates the decreased amounts of DCX levels following the sevoflurane treatment as compared to the control condition (** p = 0.004). N = 6–8 in each group. Student’s t-test was used to analyze the data.

