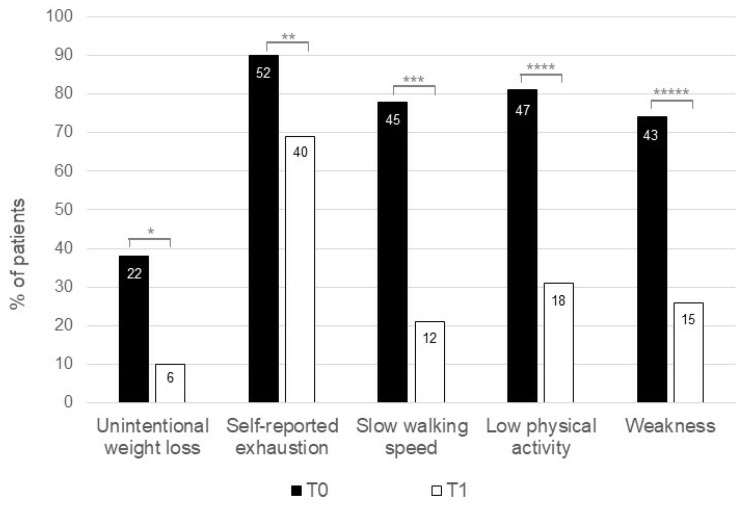
Figure 2.
Changes in each component of the Fried frailty phenotype between the baseline and the end of the study. Difference assessed with the McNemar test for unintentional weight loss, self-reported exhaustion, slow walking speed, low physical activity, and weakness was statistically significant for each item: * p < 0.0001, ** p = 0.012, *** p < 0.0001, **** p < 0.0001, ***** p < 0.0001.

