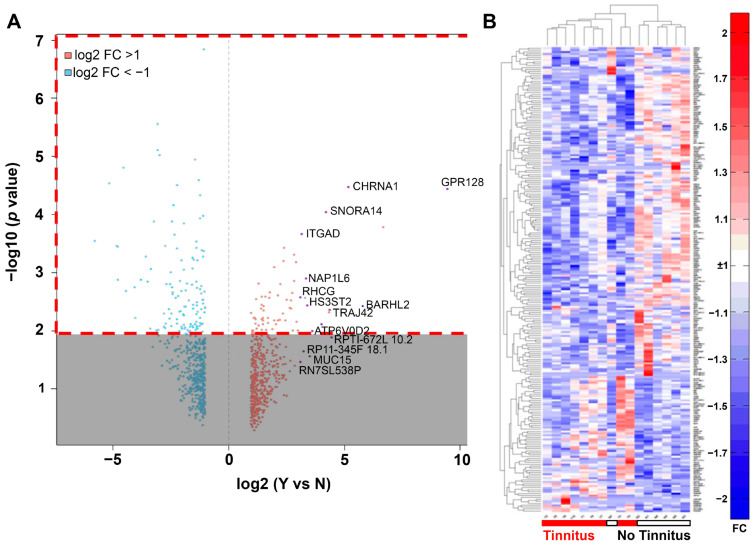
Figure 3.
Bioinformatic analysis of genes that were differentially expressed in VS samples stratified by the presence or absence of associated tinnitus. (A) Volcano plot highlighting differentially expressed genes associated with tinnitus (n = 9 [VS samples]) vs. no tinnitus (n = 7). Transcripts with >2-fold change in expression are shown as red (up-regulated) and blue dots (down-regulated). The dashed red box highlights genes that were selected for the heatmap. (B) Heatmap of RNA-seq gene expression levels (log2 of RPKM) compared between patients with and without tinnitus. A total of 179 differentially expressed genes were detected based on the cutoffs of >2-fold change and p-value < 0.01. The heatmap is clustered hierarchically by both samples (columns) and genes (rows). Red indicates differentially higher and blue indicates differentially lower levels of gene expression between groups. Abbreviations: RNA-seq, RNA sequencing; VS, vestibular schwannoma.

