Figure 1.
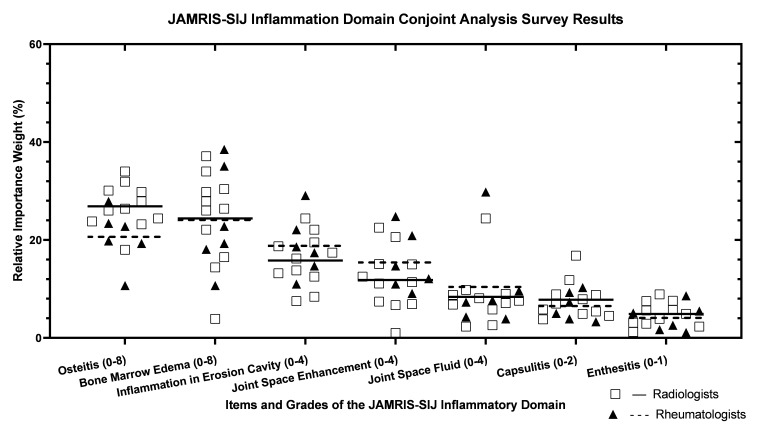
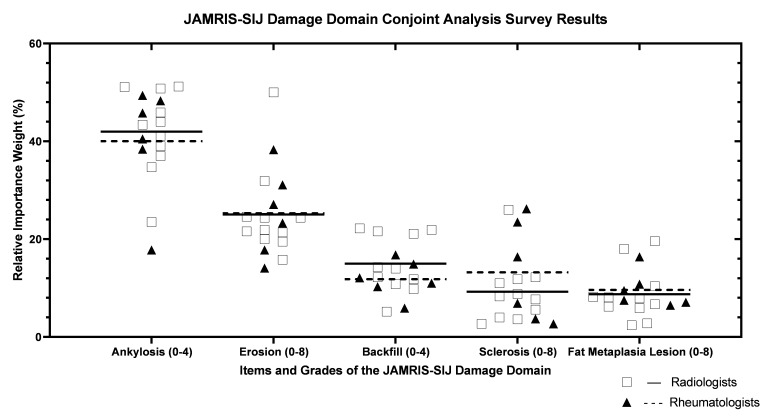
(A,B) Scatter plots of item weights derived from the conjoint analysis survey (CAS)-derived weights. (A) Scatter plots of inflammation domain item weights derived from the conjoint analysis survey (CAS)derived weights. Relative weights from all participants are plotted for each of the JAMRIS-SIJ inflammation domain items, with lines representing the median weight for radiologists (Square marker and solid line n = 11) and rheumatologists (triangular and broken line, n = 6). (B) Scatter plots of the damage domain item weights derived from the CAS-derived weights. Relative weights from all participants are plotted for each of the JAMRIS-SIJ damage domain items, with lines representing the median weight for radiologists (Square marker and solid line n = 11) and rheumatologists (triangular and broken line, n = 6).


