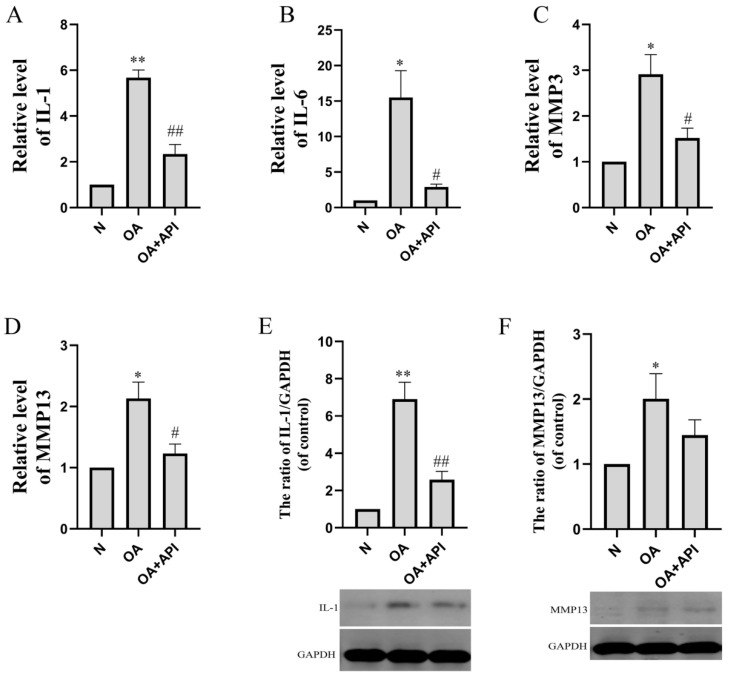
Figure 3.
The effect of apigenin on the levels of inflammation-related mRNA and proteins of chondrocytes in OA mice. Relative quantities of inflammation-related genes are expressed as fold differences compared to the control. (A) IL-1, (B) IL-6, (C) MMP3, (D) MMP13, (E) IL-1 protein level, and (F) MMP13 protein level. Above, densitometric analysis; below, representative images of immunoblots. Data are the mean ± SD of the mean (n = 3). * p < 0.05 versus normal group (N); ** p < 0.01 versus normal group (N); # p < 0.05 versus OA group; ## p < 0.01 versus OA group.

