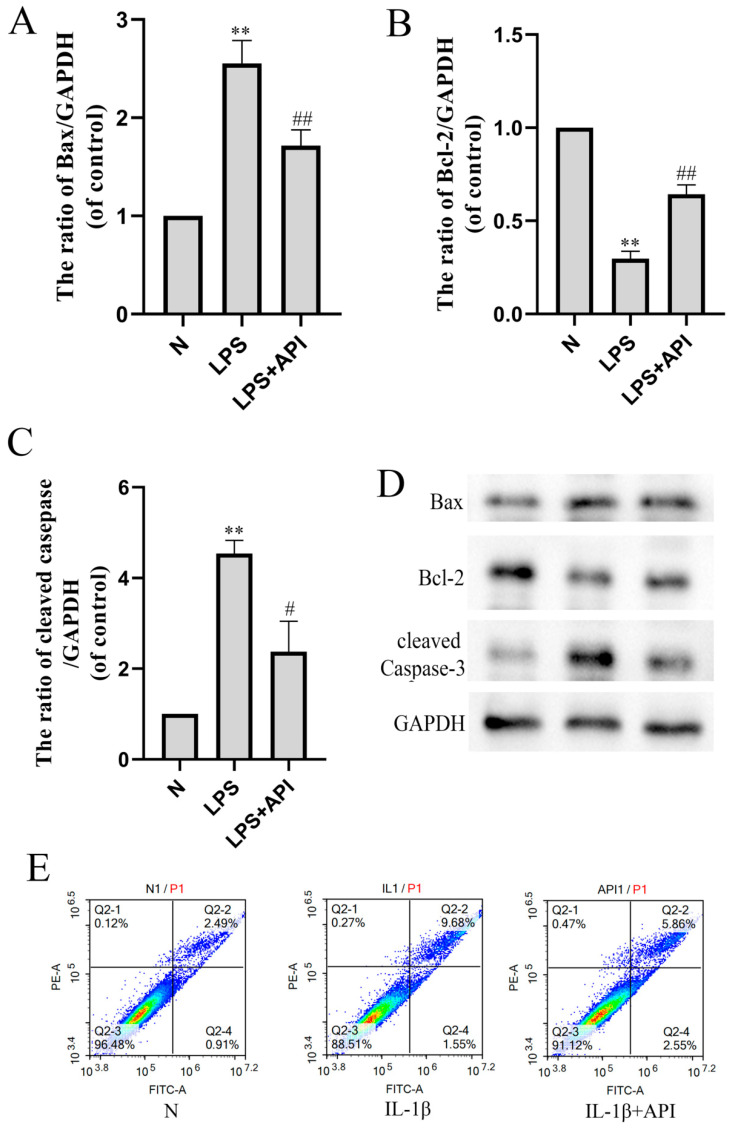
Figure 9.
The effect of apigenin on chondrocyte apoptosis in the macrophage–chondrocyte coculture system. (A) Bax protein level; (B) Bcl-2 protein level; (C) cleaved-caspase3 protein level; (D) Representative Western blotting images of Bax, Bcl-2, and cleaved-caspase3; (E) Flow cytometry of chondrocytes in the macrophage–chondrocyte coculture model. In the two-color flow cytometry scatter plot, the Annexin V-FITC is represented on the X axis and the PI is represented on the Y axis. Living cells were double negative (Annexin V-FITC-/PI-), early apoptotic cells were Annexin V-FITC+/PI- positive (Annexin V-FITC+/PI-), late apoptotic cells were Annexin V-FITC and PI positive (Annexin V-FITC+/PI+). Data are the mean ± SD of the mean. ** p < 0.01 versus normal group (N); # p < 0.05 versus LPS group; ## p < 0.01 versus LPS group.

