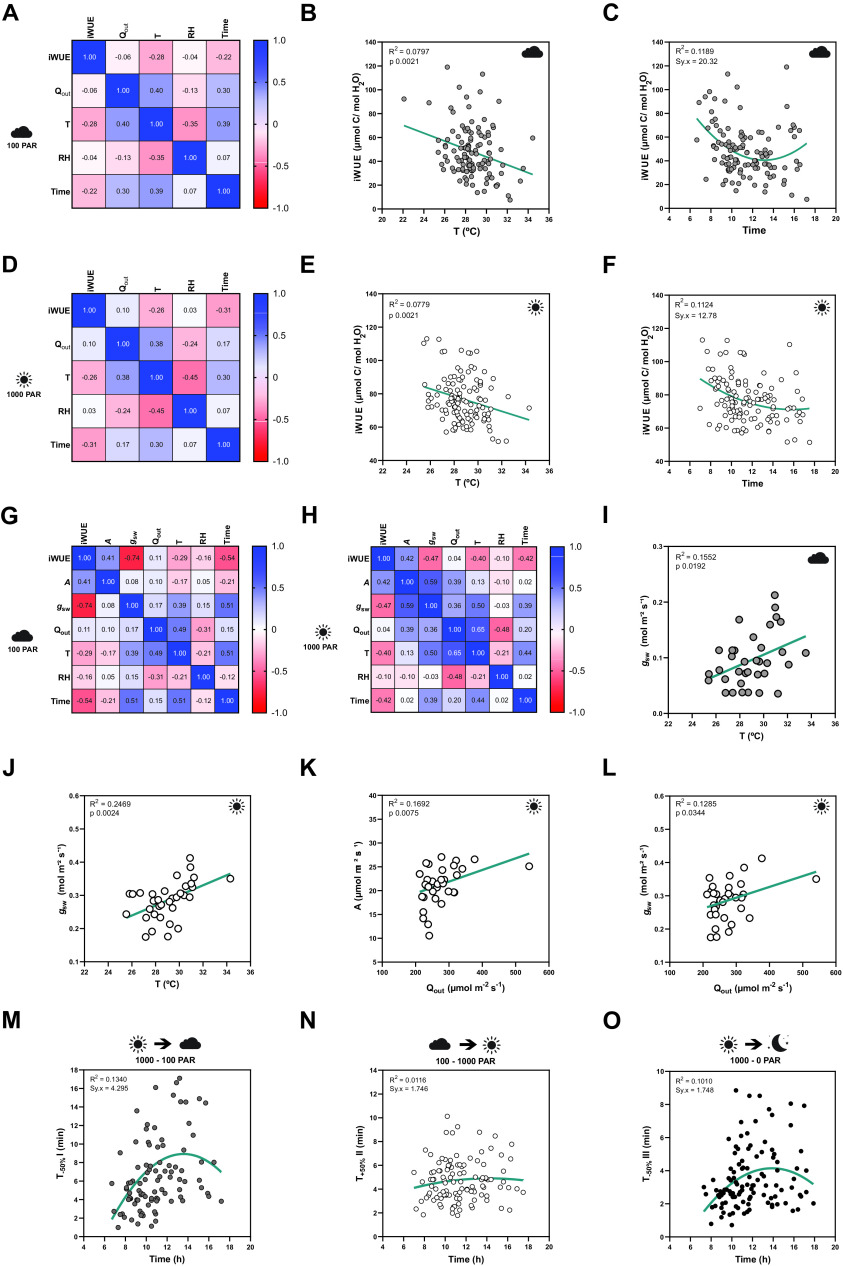
Figure 2.
Influence of temperature, ambient light and diurnal rhythm on leaf-level gas exchange. (A) Correlation matrix between iWUE and environment (Q out, T, RH and time) of 120 measurements of wild-type B. distachyon (Bd21-3) at 100 PAR (second light step). (b) Linear regression between T and iWUE at 100 PAR (n = 116). (c) Non-linear regression between time and iWUE at 100 PAR (n = 116). (d) Correlation matrix between iWUE and environment (Q out, T, RH and time) of 120 measurements of wild-type B. distachyon (Bd21-3) at 1,000 PAR (third light step). (e) Linear regression between T and iWUE at 1,000 PAR (n = 119). (f) Non-linear regression between time and iWUE at 1,000 PAR (n = 120). (g) Correlation matrix between gas exchange parameters (A, g sw and iWUE) and environment (Q out, T, RH and time) of the 35 measurements (corrected by individual leaf area) of wild-type B. distachyon (Bd21-3) at 100 PAR (second light step). (h) Correlation matrix between gas exchange parameters (A, g sw and iWUE) and environment (Q out, T, RH and time) of the 35 measurements (corrected by individual leaf area) of wild-type B. distachyon (Bd21-3) at 1,000 PAR (third light step). (i) Linear regression between T and g sw at 100 PAR (n = 35). (j) Linear regression between T and g sw at 1,000 PAR (n = 35). (k) Linear regression between Q out and A at 1,000 PAR (n = 35). (l) Linear regression between Q out and g sw at 1,000 PAR (n = 35). (m) Non-linear regression between half-time of the transition 1,000–100 PAR (T −50%I) and time of the day (time) (n = 99). (n) Non-linear regression between half-time of the transition 100–1,000 PAR (T +50%II) and time of the day (time) (n = 111). (o) Non-linear regression between half-time of the transition 1,000–0 PAR (T −50%III) and time of the day (time) (n = 111). R 2 and Sy.x or p values are indicated.

