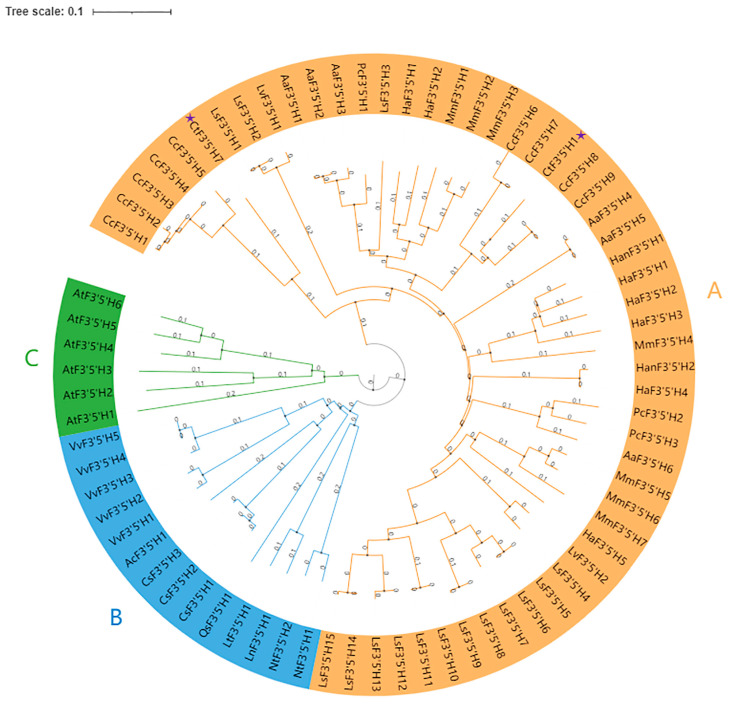
Figure 1.
Phylogenetic analysis of F3’5’H sequences from safflower and other plant species. The scale bar represents 0.1 substitutions per site. The two candidate safflower genes are marked with purple stars. All members of F3’5’H were divided into three subgroups including (A) containing 53 F3’5’H members shown with orange color (B) containing 14 F3’5’H members shown with blue color and (C) containing 6 F3’5’H members shown with green color.

