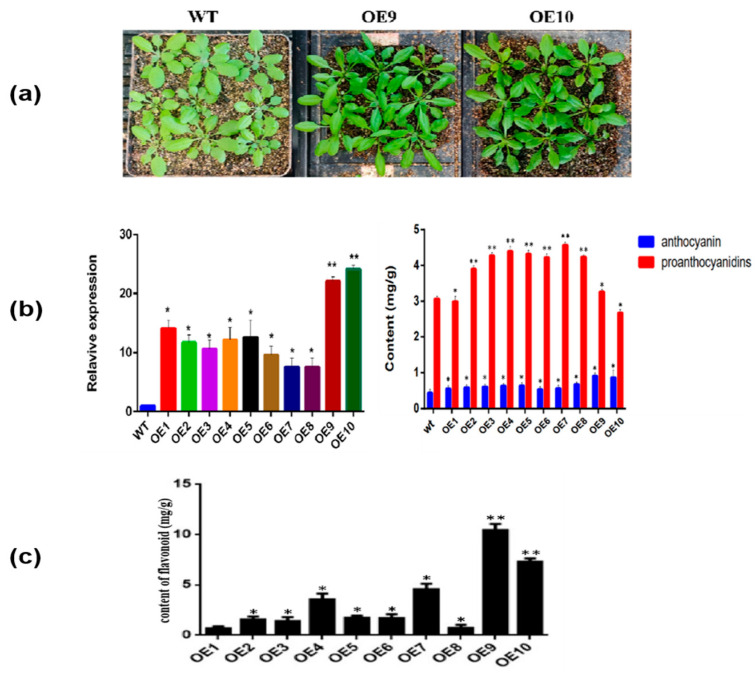
Figure 5.
Characterization of CtF3′5′H1 overexpressed transgenic Arabidopsis. (a) Phenotypic analysis of transgenic and WT plants. Using constant photographic conditions and light intensity, the transgenic plants demonstrated dark greenish leaves with elongated and curlier morphology than the WT. (b) Analysis of relative gene expression and anthocyanin proanthocyanin content in transgenic and WT plants. The relative expression level of CtF3′5′H1 and accumulation of anthocyanin proanthocyanin content were relatively high in OE9 and OE10 lines compared to WT and remaining transgenic lines. (c) Quantification of the total flavonoid content in different transgenic lines. One-way ANOVA was used to calculate statistical significance among different groups. The asterisks represent (*: p > 0.05, **: 0.01 < p < 0.05).

